Published on
March 6, 2025

In SaaS, tracking the right metrics can help you improve customer acquisition, reduce costs, and boost long-term growth. Here are the 7 key SaaS metrics every business should monitor:
These metrics are interconnected. For example, improving LTV while reducing CAC shortens the payback period, helping you scale efficiently. Use tools like Google Analytics, Mixpanel, and HubSpot to track and optimize these KPIs. Start monitoring these metrics today to refine your funnel and drive growth!
Customer Acquisition Cost (CAC) measures how much it costs to turn a prospect into a paying customer. It's a key metric for understanding profitability and growth potential. Breaking down these costs can help you make smarter decisions about where to spend your budget.
Here’s the formula for calculating CAC:
CAC = (Total Sales & Marketing Costs) ÷ (Number of New Customers Acquired)
The "total costs" in this formula include:
As Patrick Wallain, Founder and CEO of ABLEMKR, puts it:
"If you want to sleep better at night, hire Phoenix Strategy Group."
Lowering CAC can make your business more efficient. Here are some strategies to consider:
| Funnel Stage | Key Focus Areas | How It Helps CAC |
|---|---|---|
| Awareness | Targeting and visibility | Cuts down wasted ad spend |
| Consideration | Better content and engagement | Drives organic conversions |
| Decision | Streamlined sales process | Speeds up the sales cycle |
| Purchase | Smoother payment process | Increases close rates |
Once you’ve optimized CAC, the next step is to look at how much value each customer brings over time by tracking Customer Lifetime Value (LTV).
Once you've optimized CAC, it's time to look at how much revenue each customer can bring in. This is where Customer Lifetime Value (LTV) comes into play. LTV represents the total revenue you can expect from a customer over their relationship with your business.
Here's the basic formula for calculating LTV:
LTV = (Average Revenue Per User × Average Customer Lifespan) - CAC
For subscription-based SaaS companies, the formula is slightly different:
LTV = (Monthly Recurring Revenue × Gross Margin %) × (1 ÷ Monthly Churn Rate)
To maximize LTV, you can focus on two main areas:
Increase Revenue Per Customer
Extend Customer Retention
Different pricing strategies can affect LTV in unique ways. Here's a breakdown:
| Pricing Model | Impact on LTV | Best For |
|---|---|---|
| Per-User | Grows with team size | Collaboration tools |
| Usage-Based | Increases with customer use | Infrastructure services |
| Tiered | Encourages upgrades | Platforms with rich features |
| Hybrid | Balances revenue streams | Complex solutions |
The LTV:CAC ratio is a key metric for understanding your business's financial health. Here's what different ratios mean:
| Ratio | Business Health | Action Needed |
|---|---|---|
| < 1:1 | Losing money | Reassess acquisition costs |
| 3:1 | Healthy | Maintain strategy |
| > 4:1 | Highly profitable | Scale acquisition efforts |
Keep in mind, LTV isn't static. Regularly update your calculations to reflect changes in customer behavior and business dynamics. This insight will help you refine acquisition strategies and prepare for the next step: analyzing conversion performance.
Conversion rate shows the percentage of leads that turn into paying customers as they move through your acquisition funnel. It highlights how well your marketing efforts are working and helps identify where prospects drop off.
The overall conversion rate formula is simple:
(Number of Conversions ÷ Total Number of Leads) × 100
You can also calculate stage-specific rates for deeper insights. Here's a breakdown:
| Funnel Stage | Calculation | Typical Range |
|---|---|---|
| Visit-to-Lead | Leads ÷ Total Visitors | 2–5% |
| Lead-to-Marketing Qualified Lead (MQL) | MQLs ÷ Total Leads | 15–20% |
| MQL-to-Sales Qualified Lead (SQL) | SQLs ÷ Total MQLs | 20–30% |
| SQL-to-Opportunity | Opportunities ÷ Total SQLs | 30–40% |
| Opportunity-to-Customer | Customers ÷ Total Opportunities | 20–30% |
Next, focus on what influences these rates and how to improve them.
To improve conversion rates, focus on these areas:
Building trust is also crucial. Use elements like:
Fine-tune your funnel through A/B testing. Experiment with:
Personalization can also make a big difference. Tailor experiences based on:
Use these tools to monitor and improve conversion rates:
Make sure your metrics align with your business goals to maximize results.
Time to First Value (TTFV) tracks how quickly new users experience value from your product. A faster TTFV can improve conversion rates, customer satisfaction, and retention, making it a key metric for a strong acquisition funnel.
TTFV is made up of two main stages:
| Phase | Description | Key Activities |
|---|---|---|
| Technical Implementation | Setting up and configuring the product | Account creation, integration setup, data import |
| User Adoption | Learning and achieving first success | Training, exploring features, reaching initial value |
This structure helps you measure TTFV effectively.
Track TTFV by monitoring feature activation, key success milestones, and the time it takes to complete essential setup tasks.
Design an onboarding process that gets users to their first success quickly. Eliminate extra steps and focus on delivering core value right away.
Break the journey into small, clear steps. Each milestone should bring users closer to realizing the product’s main benefits.
Provide help exactly when users need it, such as:
A shorter TTFV often results in:
Use tools like Mixpanel, Amplitude, Pendo, Heap, Gainsight, or ChurnZero to monitor and optimize TTFV.
Speeding up the time it takes for users to see value minimizes friction and strengthens your acquisition funnel. Up next, we’ll dive into how Lead Growth Rate impacts your funnel’s progress.
Lead Growth Rate (LVR) tracks how much your qualified leads grow month-over-month, giving insight into how well your lead generation efforts are performing. Like conversion rates, monitoring lead growth helps you stay on top of your funnel's progress.
Here’s the formula to calculate LVR:
LVR = [(Current Month's Leads - Previous Month's Leads) / Previous Month's Leads] x 100
For instance, if you generated 150 leads in February and 200 in March, the calculation would be:
LVR = [(200 - 150) / 150] x 100 = 33.33%
Churn rate is the percentage of customers who cancel or don’t renew their subscriptions within a specific time frame. It directly affects revenue and growth, making it a key indicator of customer satisfaction and how well your product fits the market.
Here’s the formula for calculating monthly churn rate:
Monthly Churn Rate = (Customers Lost in Month / Total Customers at Start of Month) x 100
For instance, if you start January with 1,000 customers and lose 30 during the month, your churn rate would be: (30 / 1,000) x 100 = 3%.
To get a clearer picture, break churn down into these categories:
You can address churn at various stages of the customer lifecycle with targeted actions:
| Timing | Action Items | Expected Outcome |
|---|---|---|
| First 30 Days | Provide thorough onboarding, share usage tips, and offer training sessions | Better retention in the early stages |
| 31–90 Days | Track usage trends, schedule proactive check-ins, and share success stories | Increased engagement and identification of at-risk accounts |
| 90+ Days | Share feature updates, hold periodic reviews, and offer loyalty rewards | Stronger long-term customer relationships |
Churn benchmarks differ by market. Enterprise SaaS tends to have lower churn rates compared to mid-market or SMB models, so tailor your strategies accordingly.
For more help with managing churn and improving your customer acquisition funnel, you might consult experts like Phoenix Strategy Group (https://phoenixstrategy.group), which provides strategic advice for growth-stage companies. Understanding churn is also a critical step in assessing how quickly you can recover customer acquisition costs.
The CAC Payback Period helps you understand how long it takes to recover the money spent on acquiring a customer. This metric is especially useful when evaluating conversion efficiency and customer retention.
To calculate it, you'll need two key numbers: your Customer Acquisition Cost (CAC) and your monthly recurring revenue (MRR) per customer. The formula looks like this:
CAC Payback Period = CAC ÷ MRR per customer
For instance, if your CAC is $1,000 and each customer brings in $200 per month, the calculation would be:
1,000 ÷ 200 = 5 months
This means it would take 5 months to recover the acquisition cost for each customer. Keeping an eye on this metric gives you a clear picture of how quickly your investments start paying off.
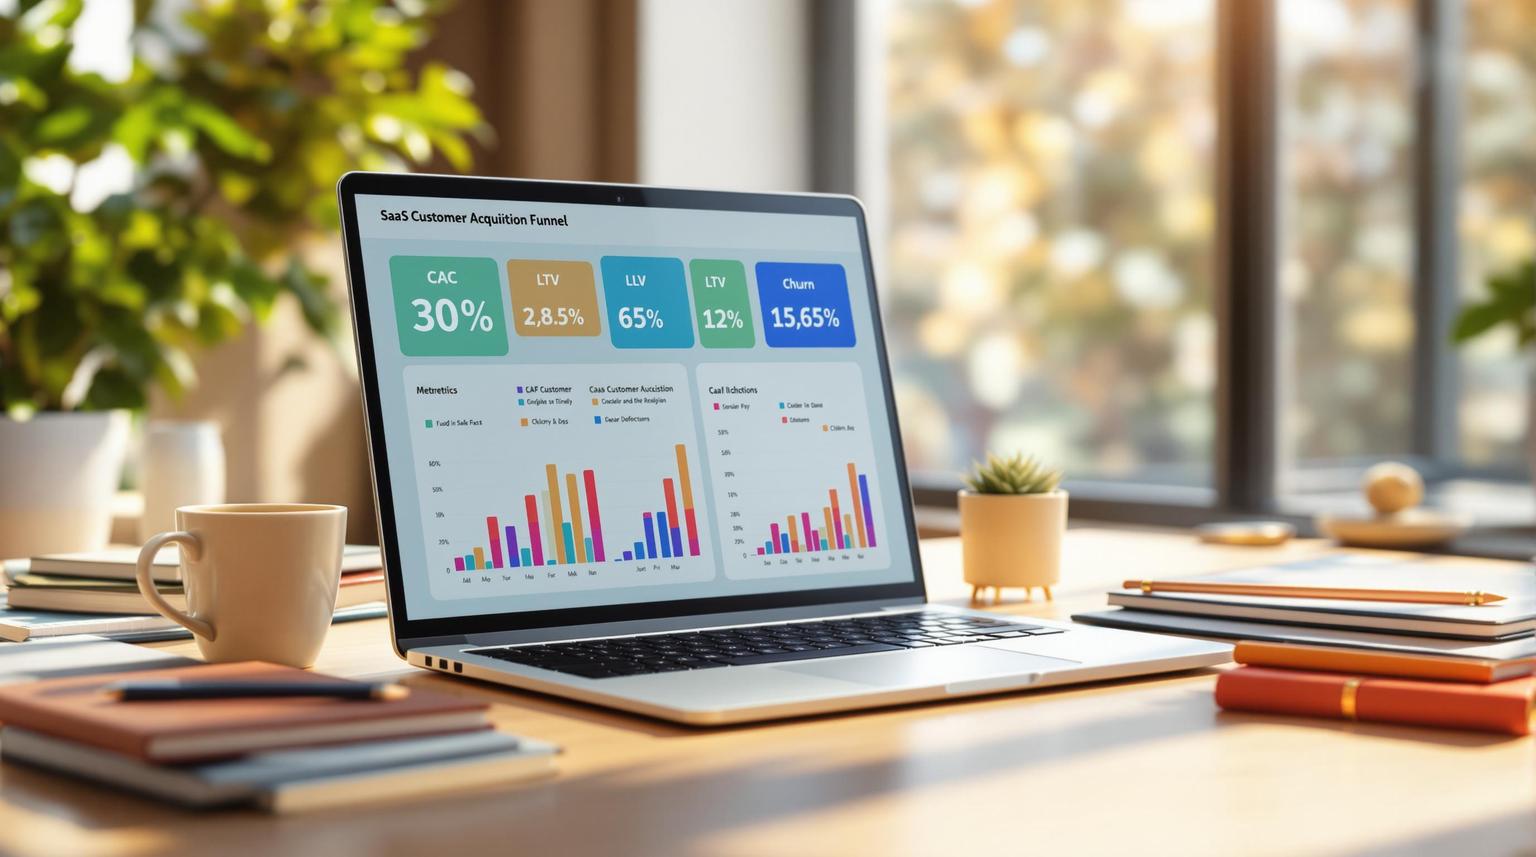
The metrics we've covered play a key role in refining your acquisition funnel. They provide the insights needed to make quick, informed decisions that can fuel consistent growth. Using real-time financial dashboards, businesses can spot bottlenecks, adjust their acquisition tactics, and improve profitability.
These metrics are interconnected - improving one often strengthens the entire funnel. For instance, cutting down your CAC while keeping a strong LTV can shorten your payback period, freeing up funds for expansion.
For SaaS companies aiming to scale, having reliable tracking systems is essential. Integrated financial tools deliver real-time data that supports smarter decision-making.
Regularly monitoring these numbers helps you spot patterns, fine-tune spending, and adjust strategies as needed. This approach turns raw data into actionable plans, helping businesses acquire and retain customers more effectively.
Keep in mind, these metrics aren't just static figures - they’re dynamic tools to guide your strategy. By focusing on these KPIs and using the right tools, SaaS companies can create a more efficient, profitable acquisition funnel and set the stage for long-term growth.