Published on
August 8, 2026


If you can’t explain why ARR will move next month, your forecast isn’t doing its job.
I’d boil this down to one idea: forecast ARR with a monthly waterfall tied to actual drivers - new logos, expansion, contraction, and churn - instead of using one flat growth rate. That means I’d build the model from pipeline, renewal dates, churn risk, pricing changes, and expansion patterns, then update it every month, backtest it, and run base, upside, and downside cases.
Here’s the article in plain English:
A few numbers stand out. Enterprise SaaS teams often aim for 3%–7% annual logo churn, while SMB businesses may run closer to 10%–15%. SaaS gross margin often lands around 70%–85%. And if an AE takes about 5.7 months to ramp, hiring has to happen months before ARR shows up.
My takeaway: this article is less about predicting one number and more about building a clean monthly system that shows what changed, why it changed, and what you should do next.
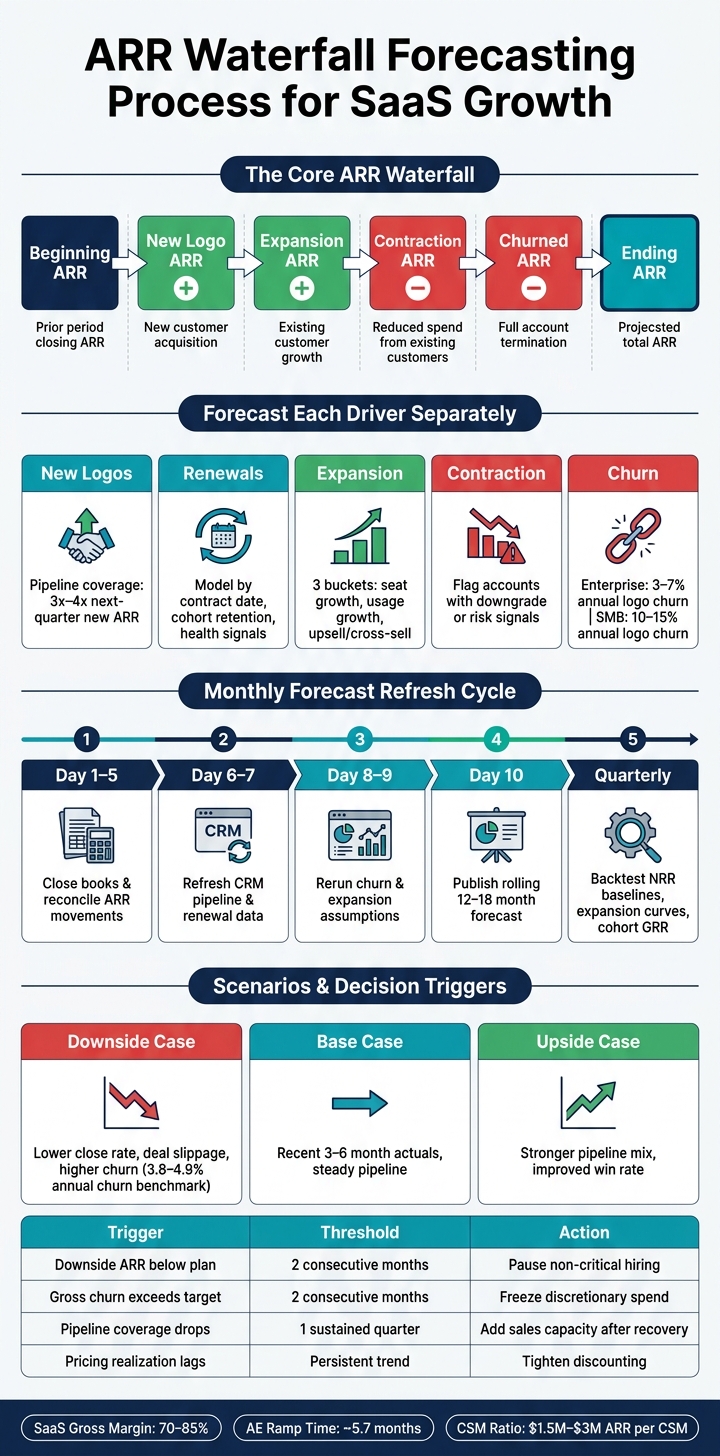
ARR Waterfall Forecasting Process for SaaS Growth
Turn each waterfall line into a forecast tied to actual revenue drivers. Start with new ARR. Then add renewals, expansion, and churn. The key is to model new logos, renewals, expansion, and churn as separate pieces, with each one linked to a deal, contract, or account.
Start with an opportunity-level export from your CRM. Include opportunity ID, segment, product, stage, close date, ARR, and a new-business vs. expansion flag.
From there, apply two adjustments based on your last 6–12 months of historical data:
This keeps the forecast grounded in how your pipeline actually behaves, not how reps hope it will behave. Also track pipeline coverage at 3–4× next-quarter new ARR to offset slippage and losses.[2][1]
Build a renewal calendar from your billing system that shows each contract’s ARR, renewal date, and segment. For every renewal month, model logo churn, dollar churn, and contraction on accounts that stay.
Use cohort retention curves to set those rates. Then layer in customer health signals like usage trends, NPS, and support tickets for large or at-risk accounts. That extra step matters. A flat churn assumption can hide trouble until it’s too late.
B2B SaaS benchmarks differ by segment. Enterprise teams often target 3–7% annual logo churn, with best-in-class below 3–5%. SMB-focused products often see 10–15% as acceptable, with best-in-class below 8%.[3][4]
For large or shaky accounts, model them one by one with retain, downgrade, or churn scenarios.
After renewals and churn, model expansion on its own so it doesn’t get buried inside retention assumptions.
Model expansion in three buckets: seat growth, usage-driven growth, and sales-led upsell or cross-sell.
For seat growth, use historical net seat adds per active customer by segment. For usage, apply recent trailing averages and seasonality, then use a conservative growth rate. That gives you a forecast with some restraint instead of one built on wishful thinking.
Model pricing and packaging changes by effective date, affected cohorts, customer segment, and expected ACV impact. If a price increase also pushes churn up, show the net ARR impact, not just the upside on contract value.
These changes shape both net retention and forward ARR, not just contract pricing.
Lock these driver assumptions before the monthly refresh cycle.
Once the driver model is in place, the next step is simple in theory and a little messy in practice: update it every month on a set schedule. A forecast only helps if actuals and assumptions stay current. The aim is a repeatable process that keeps actuals, pipeline, and assumptions in sync.
Run the cycle on the same calendar each month. A practical schedule is to close the books and reconcile ARR movements by the 5th business day, refresh CRM pipeline and renewal data by day 7, rerun churn and expansion assumptions by day 9, and publish an updated rolling 12–18 month forecast by day 10.[5][12]
The steps build on one another. Accounting closes actuals. Finance reconciles ARR to the ledger. Sales ops cleans up pipeline. Customer success updates risk. A fractional CFO or FP&A lead refreshes the model. Each monthly close should restate beginning ARR, actual drivers, and ending ARR so the process stays a direct continuation of the waterfall model.
Each forecast line should tie back to one source of truth. The CRM owns pipeline and bookings. The billing system owns subscriptions, ARR, and renewal schedules. The data warehouse and BI layer bring together product usage and health signals.[6][9][10]
Your dashboard should track the drivers that move ARR:
The monthly dashboard should show current ARR by segment, net new ARR split into new logo, expansion, contraction, and churn, pipeline coverage ratio - usually 3–4x next-quarter new ARR - the renewal calendar with risk status, GRR, and NRR.[7][8][9] Those views should feed the scenario assumptions in the next step.
Every month, compare the model’s prediction with what actually happened. Do it at the component level: forecasted new logo ARR, renewal ARR, expansion ARR, and churn ARR versus actuals, broken out by segment and sales motion.[5][11]
Then trace each variance back to the driver. Maybe win rates were too high. Maybe deals slipped into the next month. Maybe average deal sizes came in smaller than expected. Don’t change assumptions after one odd month. Wait for two to three months of persistent variance, usually above 5% to 10%.[5]
Quarterly backtests are the right time to revisit longer-range assumptions like NRR baselines, long-term expansion curves, and cohort-level GRR. Monthly reviews should stay focused on operating inputs like pipeline conversion, close timing, and near-term renewals.[5] That’s what keeps hiring plans and cash projections believable. Then use the refreshed forecast as the base case for scenario planning.
After the monthly backtest, use scenarios to see what happens when key drivers move up or down. The monthly forecast should guide operating decisions, so run base, upside, and downside cases side by side. Keep the same ARR waterfall in each case. The only thing that changes is how hard you push each driver.
Use the same ARR waterfall in all three scenarios. The inputs that usually move ARR the most are pipeline coverage, win rate, ACV, sales cycle, renewals, churn, expansion, and pricing realization.[13][14]
Start with the last 3–6 months of actuals. Then adjust for changes you already know are coming, like a product launch, a pricing update, or new sales headcount. The base case should stay close to recent performance. The upside case can assume a modest lift from a stronger pipeline mix. The downside case can assume a small drop in close rate or a one-stage delay.
Model renewals, churn, and expansion separately. They react to different signals, and they call for different actions from the team. It also helps to segment customers by cohort or risk profile, so the downside case puts more pressure on weaker accounts without overstating churn across the whole base. With B2B SaaS annual churn often landing around 3.8% to 4.9%,[18] even a small move in gross churn can change ARR and runway in a meaningful way.
The model should make the story obvious at a glance. Leadership should be able to see what changed - pipeline coverage fell, pricing realization slipped, renewal timing moved - instead of staring at a new ARR number and guessing why.[14][17]
Once the scenario inputs are in place, test which variables move ARR the most. Sensitivity analysis lets you isolate the effect of one variable at a time. In most SaaS models, the biggest movers are usually churn rate, close rate, and sales cycle length. A tornado ranking can help show where leadership should focus first.[15][16]
Then connect those outputs to pre-set decision triggers and clear owners.[14] That way, when a metric slips, the response isn't made up on the fly.
| Trigger | Threshold | Action |
|---|---|---|
| Downside ARR falls below plan by a set percentage | Two consecutive months | Pause noncritical hiring |
| Gross churn exceeds threshold | Two consecutive months | Freeze discretionary spend |
| Pipeline coverage drops below target | Sustained for one quarter | Add sales capacity after recovery |
| Pricing realization lags list prices | Persistent trend | Tighten discounting |
Use these scenario outputs to shape hiring, spend, and cash plans.
The scenario outputs from the previous step only matter if they change actual decisions. So your ARR forecast needs to feed straight into hiring plans, cash planning, and board reporting.
Start with a basic sales-capacity formula: Required AEs = Net New ARR ÷ (Quota per AE × Blended Attainment).[20] Then add ramp time and attrition to turn that number into the gross hires you’ll need.
This is where many teams get caught flat-footed. If your model assumes 30% annual AE attrition and a 5.7-month average ramp[22], you can’t wait until growth shows up to hire. You need that capacity in place earlier - usually 3–6 months before the ARR growth arrives.
Customer success works the same way. A common benchmark is $1.5 million–$3 million ARR per CSM for mid-market accounts, with adjustments for account complexity.[2][28] If your forecast says that ratio is about to break, that’s your cue to start hiring.
It also helps to watch ARR per employee (Total ARR ÷ FTE count) as a guardrail.[28] That one metric can keep headcount asks grounded across the whole company, not just sales and CS.
Once staffing is mapped out, use that same ARR forecast to plan revenue and cash timing. Take the monthly ARR curve and project revenue, collections, and burn from it. Map ARR to GAAP revenue recognition, then to cash receipts based on billing terms and average days sales outstanding (DSO). From there, apply gross margin - often 70%–85% for SaaS businesses[19][21] - to estimate gross profit, then add OpEx to get monthly burn and ending cash.
The downside case matters most here. Use it to pressure-test runway and fundraising timing. If the model shows cash strain coming, that should shape when you begin a raise - not after things already look tight.
For the board, strip the model down to the few numbers that carry the most signal. Directors don’t want a giant dashboard. They want the handful of metrics that explain what’s going on.
The usual package includes:
Pair those with leading indicators like quota capacity, ramp status, and pipeline coverage by stage so the board can see where ARR is headed, not just where it’s been.[19][24]
One discipline matters a lot here: state your ARR methodology on the same slide.[26][27] Spell out what’s included, what’s excluded, and how the number ties back to your billing system. By Series B and later, boards and investors usually expect 18–24 months of ARR waterfall history with one steady methodology.[27] If the CRM says one thing and finance says another, trust starts to slip fast.
Start by pulling data from your CRM, billing, and accounting systems into one dashboard your team can trust. If the numbers live in three different places, forecasting gets messy fast.
Your model should start with current MRR and then layer in new MRR, expansion MRR, churned MRR, and contraction MRR. That gives you a clean view of what’s coming in, what’s growing, and what’s slipping out.
You’ll also want to gather:
Use a monthly refresh cycle as your baseline.
Each month, compare actuals against the forecast, run a variance analysis, and watch for drift. If results move by 5% to 15%, dig into what changed and update your assumptions right away.
You should also refresh the forecast around major operational events, such as:
On top of that, add a deeper quarterly review so your long-term plans stay aligned.
ARR scenarios help shape hiring and cash plans because they show two simple things: how long your runway lasts and how much room you have to invest.
When you model base, best-, and worst-case outcomes, you can see how changes in churn, expansion, and pipeline conversion affect monthly burn and total cash balance. That matters more than it may seem at first glance. A small shift in conversion or churn can ripple through the whole plan.
If a scenario pushes runway below a set threshold, such as 12 months, that can trigger slower hiring or cuts to discretionary spending. On the flip side, stronger scenarios may support faster hiring, often shown through ramp-up curves.