Published on
August 7, 2026


If you can’t measure your audit trail, you can’t prove your controls worked. The article comes down to eight numbers that tell you if your logs are complete, reviewed on time, protected from tampering, and kept long enough for SOX, HIPAA, and PCI DSS.
Here’s the short version: I’d track log completion rate, review cycle time, exception count, access change volume, unresolved gaps, report turnaround time, log integrity verification rate, and retention compliance rate. Together, these metrics answer the main audit questions: Was the event logged? Was it reviewed on time? Was anything wrong? Was access changed with approval? Was the issue fixed? Was the report sent on time? Was the log altered? Was the record kept long enough?
A few numbers stand out right away:
If I were setting up a dashboard, I’d group the metrics into four simple checks:
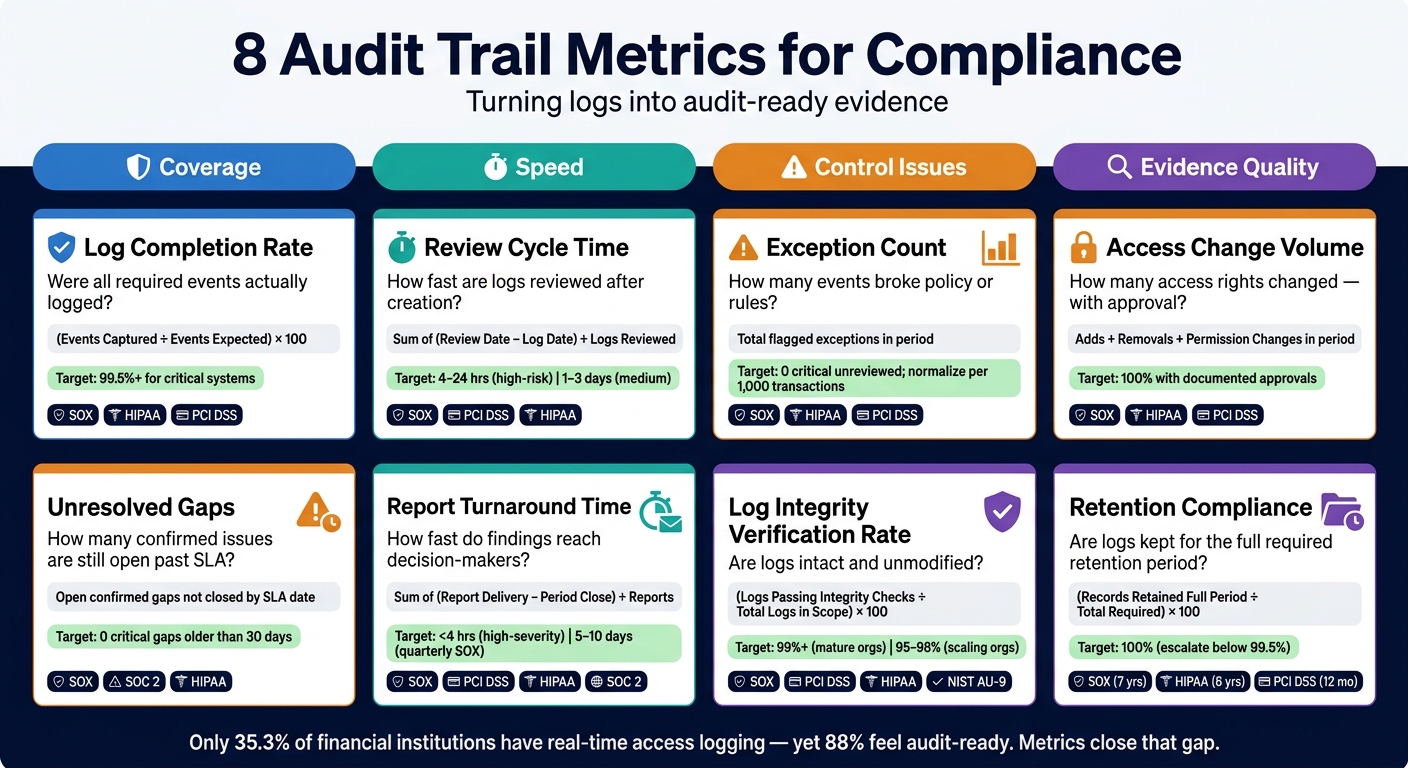
8 Audit Trail Metrics for Compliance: Benchmarks & Targets
| Metric | What it tells you | Common target |
|---|---|---|
| Log Completion Rate | Whether required events were logged | 99.5%+ for critical systems |
| Review Cycle Time | How long review takes after log creation | 4–24 hours for high-risk items |
| Exception Count | How many events break policy or rules | Review all high-risk items fast |
| Access Change Volume | How many access rights changed | 100% with approval records |
| Unresolved Gaps | How many confirmed issues are still open | 0 critical gaps past SLA |
| Report Turnaround Time | How long it takes to send reports | Same day to 10 business days, based on type |
| Log Integrity Verification Rate | Whether logs remain intact | 99%+ in many in-scope systems |
| Retention Compliance Rate | Whether logs were kept long enough | 100% |
In plain English, this article is about turning “we have logs” into proof you can show an auditor, examiner, or investor.
Logs by themselves don't prove compliance. Metrics do. They show whether audit trails are complete, on time, and documented. That's the line between a control that looks fine on paper and one that can hold up under scrutiny.
Regulators and auditors want proof that monitoring happens on a steady basis and that the work is documented. A StrongDM survey of financial institutions found that only 35.3% have real-time access logging, while 88% of respondents felt audit-ready.[3] That disconnect is exactly what metrics bring into the open. It's why the next eight metrics focus on completeness, timeliness, integrity, and retention.
FINRA and SEC penalties also make the stakes pretty clear: weak recordkeeping and poor oversight can get expensive.[4][5]
PCI DSS v4.0 Requirement 10 calls for daily review of security events and a minimum 12-month log retention window, with at least 3 months immediately available.[1][2] A dashboard that tracks log completion, review cycles, exceptions, and retention can answer common SOC 2 and PCI DSS questions fast. It also gives teams a straight answer when an examiner starts asking for proof.
For growth-stage companies getting ready for a raise or exit, structured metrics can make investor diligence much smoother. Phoenix Strategy Group can help align financial systems, access logs, and evidence repositories so documentation stays consistent and audit-ready.
Start here. If completion is weak, every other audit trail metric becomes less dependable.
Log completion rate measures the share of required audit events that were actually recorded in your logs during a set period. Put simply, it checks whether every required event made it into the record.
The formula is simple:
Log Completion Rate (%) = (Events captured in audit logs ÷ Events expected to be logged) × 100
Incomplete logs make evidence reconstruction much harder. Under SOX, auditors can’t confirm that financial controls worked if access changes, general ledger updates, or ERP configuration changes are missing from the record. Under HIPAA, gaps in ePHI activity logs leave covered entities unable to show that audit controls worked. Under PCI DSS, incomplete logs of cardholder data access fail Requirement 10 outright.[6][7][9]
What matters most is not just having logs, but measuring the gap between what should have been recorded and what was actually captured. That’s where teams often get stuck. The challenge is defining expected events in a clear way. Pull expected counts from source systems and captured counts from your SIEM, then reconcile them by system and event type.[6][9]
Use source systems for expected counts and centralized logging platforms for captured counts. Keep timestamps in sync, or you can end up with false gaps that send people on a wild-goose chase.[6][9]
Set thresholds based on system criticality.
| System Criticality | Recommended Threshold |
|---|---|
| SOX in-scope financial systems | 99.5% or higher[6][8] |
| Identity and access management logs | 99% or higher[6][8] |
| Operational or ancillary applications | 95%–98%[6][8] |
Treat any shortfall as an exception. Document the cause, the fix, and the closure.[6][8][9]
Once completion is measured, review cycle time shows whether those logs are being reviewed fast enough.
Once a log is complete, the next thing to measure is how fast someone reviews it. That’s what review cycle time shows.
It measures the span between log creation and the documented review.
SOX, HIPAA, and PCI DSS all expect timely review of audit-relevant activity, and this metric gives you a clear way to measure that. In other words, cycle time isn’t just an operations number. It’s a control metric.
Average Review Cycle Time = Sum of (Review Completion Timestamp − Log Creation Timestamp) ÷ Number of Reviewed Logs
Track high-risk reviews in hours and lower-risk reviews in days. It also helps to track the 95th percentile so slow outliers don’t get buried in the average.[12][15]
Use your SIEM for log creation timestamps and your ticketing or GRC system for review assignment and completion timestamps.
To make the data usable:
Without a shared event ID, cycle time data isn’t reliable.
Set targets by risk tier.[10][11][13]
| Risk Tier | Event Examples | Target Review Window |
|---|---|---|
| High | Privileged access changes, failed admin logins | 4–24 hours |
| Medium | Standard user access changes, non-critical configuration changes | 1–3 business days |
| Low | Informational or audit-only events | 7–14 days or periodic review |
When cycle times miss the target, the usual reasons are pretty simple: too many alerts, fuzzy ownership, or not enough reviewer capacity. And when reviews come in late, those delays often become exceptions, which the next metric tracks.
Exception count tracks how many audit events break approved policy, workflow, or system rules during a set period. Put simply, it shows where controls are failing, not just where logs are present.
Only include exceptions that matter to control performance, such as:
Exception count helps show whether key controls are working the way they should. Under SOX, exceptions in financial systems, like unapproved journal entries or unauthorized ERP role changes, can point to a control failure. HIPAA programs use this metric to watch for improper PHI access. PCI DSS teams use it to track anomalies like failed logins and configuration changes in cardholder data environments. Auditors usually want three things: a clear count, investigation status, and a closure record for open exceptions. [16][17][14][22][23]
Start with the raw count. Then normalize it so the metric still means something as transaction volume grows.
| Formula | Use Case |
|---|---|
| Total exceptions flagged in period | Baseline tracking; executive reporting |
| (Exceptions ÷ Total transactions) × 1,000 | Trend analysis; scaling environments |
Normalized rates help keep exception counts useful as volume increases. [18][21]
Exception data usually comes from three systems working together: your SIEM, IAM and directory logs, and application or ERP logs. In some cases, database audit logs and workflow or ticketing systems also help flag exceptions tied to sensitive data, change approvals, or skipped process steps.
The key is to pull this data into a central log aggregation layer and use the same exception tags across systems. If teams use different exception codes or labels, the same event can get counted twice. Or it can slip through the cracks.
Set thresholds by severity, not by a zero-tolerance rule. For critical exceptions tied to financial reporting systems or PHI, aim for as close to zero as possible and investigate any event right away.
Use a simple KRI band:
| Status | Active Exception Count | Required Action |
|---|---|---|
| Green | ≤ 10 | Monitor |
| Amber | 11–15 | Review |
| Red | > 15 | Escalate |
Medium- and low-severity exceptions can sit within a tight range, such as fewer than 2–5 per 1,000 relevant transactions, as long as the trend keeps moving down quarter over quarter. [19][20]
Rising exceptions often point to access drift, which the next metric measures.
Access change volume is the total number of changes made to user or system access rights during a set period. That includes every role grant, permission update, and account removal. Put simply, it helps you see whether access changes are under control or starting to drift.
For compliance, the main concern is traceability. You should be able to follow each change from the original request to approval and then to closure.
This metric should cover:
Leave out logins and sync jobs that don't change access.
Under SOX, spikes in access changes to ERP, general ledger, or revenue systems can point to higher fraud or misstatement risk. That risk gets even more serious when the changes affect users who can approve journal entries or release payments.
HIPAA teams use this metric to check that PHI access stays tightly controlled, especially for clinical, billing, and admin staff.
PCI DSS requires access to cardholder data environments to be limited on a need-to-know basis, with a clear audit trail for every change.
Across all three frameworks, auditors usually want to see three things: the change count, the linked approval, and proof of periodic review.
Track the total number of access changes and the share that have documented approval.
Also track the unauthorized change rate. That's often the clearest sign that a control has failed.
The main sources are IAM audit logs, application-specific admin logs, privileged access management tools, and ticketing systems that connect each access change to a request and approval.
Pull this data into a central warehouse. Then standardize fields like change type, approver, timestamp, and ticket ID so the data lines up cleanly.
Set thresholds using a 3–6 month baseline. If you see a sustained spike with no clear business reason, escalate it.
When access changes go up, the next step is simple: check whether any of those changes were left unresolved.
Once you identify exceptions, the next step is simple: track how long they stay open.
Unresolved gaps are confirmed audit trail issues that are still open after the remediation deadline. That can include missing log entries, incomplete records, unexplained system mismatches, and documented control failures that haven't been closed. Only count confirmed issues here. This metric is about actual risk exposure, not a pile of raw alerts.
Under SOX, aging gaps can point to weak ICFR. Under HIPAA, open log or PHI-monitoring gaps can signal weak safeguards. Under SOC 2, unresolved exceptions can weaken control effectiveness.
Start with the count of confirmed gaps still open on the report date.
Then track two supporting sub-metrics:
The raw count only tells part of the story. Aging bands matter just as much. Break open issues into 0–30, 31–60, 61–90, and 90+ day buckets so you can see where remediation is getting stuck.
Organizations with no formal tracking see about 40% of findings remain open past their target date, and a closure rate below 70% within 90 days usually points to ownership gaps, not resource constraints.[25]
This metric usually pulls from three places.
Your SIEM or log platform surfaces the initial anomalies, such as missing entries, timestamp inconsistencies, and unlogged changes. Your issue tracking or GRC system keeps the formal record for each confirmed gap, including owner, status, and open and close dates. That system serves as the system of record. Your control inventory or GRC platform links each gap to a specific control and framework requirement, which makes it easier to report by SOX, HIPAA, or SOC 2.
A solid baseline target is:
In higher-risk environments, tighten those limits. For example, allow no critical gaps beyond 7–14 days and no medium gaps beyond 30 days unless there is documented risk acceptance. Approve thresholds in the risk committee and review them each year.
Track this backlog alongside report turnaround time so you can see how fast findings move from identification to formal reporting.
Once you spot gaps, the next thing to watch is report turnaround time. This tells you how fast those findings get in front of the people who need to act on them.
At its core, this metric tracks the time between when an audit-related event happens, or when a reporting period ends, and when the matching report is delivered to internal audit, management, an external auditor, or a regulator. That can include monthly log summaries, exception reports, and regulatory compliance packages.
Report turnaround time shows how fast audit-trail data gets to decision-makers. And that matters. If reporting moves fast, the gap between detection and remediation gets shorter too.
Under SOX, timely log review reports help teams detect and fix control deficiencies before quarterly and annual filings. Under HIPAA, prompt access-log reporting supports breach detection and notification timelines. PCI DSS requires daily log reviews and prompt investigation of security events, so turnaround time becomes a direct check on whether monitoring is happening soon enough. Under SOC 2, auditors want proof that exceptions are summarized, escalated, and addressed within defined timeframes.[26][27]
Track these two numbers together:[26]
Use business days for periodic reports and hours for incident reports. Also, don't lump them together. Periodic reports and incident reports should each have their own SLA.
This metric pulls from the full chain: alert → report → approval.
Your SIEM or log management platform records when events are ingested and when alerts are generated. Your GRC or audit management tool records when reports are created, reviewed, approved, and distributed. Ticketing systems log incident creation and escalation timestamps for incident-based reports. If delivery happens manually, use the sent timestamp as the endpoint.
The main thing is to standardize which timestamps count as the start and end events, then make sure those timestamps are recorded the same way across systems.
Thresholds should vary by report type and severity.[26][27]
| Report Type | Common Target |
|---|---|
| Monthly log-review summary | 24–72 hours after period end |
| Quarterly SOX report | 5–10 business days after quarter end |
| Daily security log report | Same day or within 24 hours of log collection |
| High-severity incident report | Under 1–4 hours from alert generation |
| Medium-risk exception report | 1–3 business days |
| Low-risk issue | Up to 5 business days |
Document SLA targets in policy and review actual performance on a regular basis. If reports are arriving on time, the next step is checking whether the logs themselves are intact.
Fast reporting is nice. But it doesn't mean much if the logs behind it have been changed, broken, or gone missing.
Log integrity verification rate tracks the share of audit log records verified as intact and unmodified during a given period.[33][32] In plain English, it checks whether the record is still there, whether the hash still matches, and whether the sequence has no gaps.[24]
This metric touches several major U.S. compliance frameworks.
NIST SP 800-53 AU-9 and AU-9(3) require organizations to protect audit information and use cryptographic mechanisms to validate log integrity.[28][29] PCI DSS Requirement 10.5 says logs must be protected from modification or destruction, with at least 12 months retained and 3 months immediately accessible.[34]
Under SOX, tamper-resistant financial system logs help show that internal controls over financial reporting are working as intended. HIPAA also expects covered entities to use audit controls that produce trustworthy activity records for systems that store electronic protected health information (ePHI).
Log Integrity Verification Rate (%) = (Number of log records successfully verified as intact ÷ Total number of log records in scope) × 100%
The phrase in scope should be defined clearly by system or control. That might mean all EHR access logs or all SOX-relevant ERP transaction logs.
It also helps to break this metric out by log type. For example:
That split can show where integrity is holding up and where controls may need tighter oversight. For higher-risk systems, daily or weekly verification is often the right move. Lower-risk systems may be checked monthly.
Verification data usually comes from your centralized log management platform or SIEM, the source systems themselves, and integrity verification artifacts like hash logs, digital signatures, and reconciliation reports.
Configuration logs and change logs can also help explain sudden shifts in logging behavior. A common setup is to send nightly verification results into the compliance dashboard, grouped by system and regulatory domain.
Set the target based on system risk and audit impact.
| Organization Stage | Realistic Target | Key Condition |
|---|---|---|
| Mature (SOX/HIPAA/PCI in scope) | ≥ 99% | Documented investigation for any unverified records |
| Scaling / growth-stage | 95–98% | Clear remediation roadmap with risk-based prioritization |
If the rate drops below the target, that should trigger an alert and a root-cause review. Common causes include misconfigured agents, clock skew, and unauthorized logging changes.[30][31]
Once integrity is confirmed, the next control issue is retention. The next step is to verify that intact logs stay available for the full required window.
After you confirm log integrity, the next step is simple: make sure the logs are still there for the entire retention period. Retention compliance rate tracks the share of audit log records kept for the full period required by policy, regulation, or contract. It also checks whether those logs can still work as evidence during an audit or investigation.
Missing logs make life hard fast. If records disappear too soon, teams may not be able to rebuild user activity, trace transactions, or spot where a control failed. That can lead to audit problems and legal risk.
Common U.S. minimums include:
| Framework | Minimum Retention Period | Note |
|---|---|---|
| SOX | 7 years | Audit and financial records supporting financial statements |
| HIPAA | 6 years | Documentation, policies, procedures, and related records |
| PCI DSS 4.0 | 12 months total log history | 3 months must be immediately available |
If the same logs fall under more than one framework, use the most restrictive requirement as your baseline.[36] That turns retention into a measurable control instead of a storage footnote.
Retention Compliance Rate (%) = (Number of log records retained for the full required period ÷ Total number of log records required to be retained) × 100%
A stricter version counts only logs that are both retained and readable. A backup that cannot be restored should not count as compliant evidence in a real audit.[35]
Your main source is the system of record for logs. That might be a SIEM, a cloud audit logging platform, database audit tables, application logs, or immutable archival storage.
To check compliance, reconcile those records against:
You also need to test retention from end to end. One of the strongest checks is a periodic sample restoration near the retention boundary. In plain English, pull records close to the cutoff date and confirm they are complete and readable.
Set the target at 100%. Even small gaps can trigger audit exceptions or legal risk. For day-to-day monitoring, many organizations set an internal escalation threshold at 99.5% or higher.[35]
If 100% is out of reach because of legacy systems or migration limits, document the gap, get formal risk acceptance, and put a time limit on it. Don’t let it sit in the dark. Use this rate with the other seven metrics to tell the difference between logs that were merely kept and logs that can stand up as compliance evidence.
The table below puts all eight metrics in one place. It lets you compare what each one measures, how teams calculate it, what target they aim for, and where the data usually comes from. It also helps tie each metric back to the four themes used throughout this article: completeness, timeliness, integrity, and retention.
| Metric | Definition | Sample Formula | Benchmark / SLA | Regulatory Value | Primary System Source |
|---|---|---|---|---|---|
| Log Completion Rate | Share of required events captured in audit logs. | (Events captured ÷ Events expected) × 100% | In-scope systems: 98–99%; critical systems: 99.5%+ | SOX, PCI DSS, HIPAA, SOC 2 | ERP, SIEM, and database logs |
| Review Cycle Time | Average time from log creation to documented review. | Sum of (review date − log creation date) ÷ Number of logs reviewed | High-risk: 4–24 hours; medium: 1–3 business days; low: 7–14 days | SOX monitoring controls, PCI DSS log review, HIPAA security monitoring | Ticketing systems, GRC platforms |
| Exception Count | Count of anomalous or policy-violating events in the period. | Total events flagged as exceptions in period | 100% of high-risk exceptions reviewed within 3–5 business days | SOX deficiency tracking, PCI DSS, HIPAA access violation tracking | SIEM and security monitoring tools |
| Access Change Volume | Count of access adds, changes, and removals in the period. | Adds + Removals + Permission changes in period | 100% documented approvals | SOX user access controls, PCI DSS access management, HIPAA user provisioning controls | IAM systems, HRIS platforms |
| Unresolved Gaps | Count of confirmed audit issues still open past SLA. | Total open audit trail issues not closed by SLA date | Zero high-risk gaps past SLA | SOX remediation tracking, audit committee reporting, regulatory examinations | Issue trackers, GRC platforms |
| Report Turnaround Time | Average time from period close or alert trigger to report delivery. | Sum of (report delivery date − period close date) ÷ Number of reports | High-severity incident: under 1–4 hours; periodic reports: per defined SLA | SOX external audit requests, PCI DSS assessments, HIPAA compliance documentation, board reporting | GRC platforms, BI tools |
| Log Integrity Verification Rate | Share of logs verified as intact and unmodified. | (Logs passing integrity checks ÷ Total logs in scope) × 100% | In-scope systems: 99%+; scaling organizations: 95–98% | SOX, PCI DSS log protection, HIPAA audit record security, e-discovery | SIEM platforms, cloud audit tools, immutable storage |
| Retention Compliance Rate | Share of records retained for the full required period. | (Records retained for full required period ÷ Total records required to be retained) × 100% | Target: 100% | SOX retention rules, SEC/FINRA recordkeeping, HIPAA retention, PCI DSS | SIEM platforms, archival storage, database audit tables |
A useful pattern shows up here: several of these metrics pull from the same core systems, especially SIEM, GRC, IAM, and archival storage. That means you don’t need eight separate reporting setups. In many cases, teams can track them in a single compliance dashboard and still see which controls are about complete logging, which ones focus on review speed, which ones test log tampering, and which ones check record retention.
Because these metrics come from the same core systems, put them into one dashboard instead of spreading them across eight separate reports. That gives leaders one place to check the health of the control environment. The comparison table above explains what each metric tracks; the dashboard should show how teams use those metrics together.
Group the dashboard by control purpose so risk stands out fast. A simple red/yellow/green status on each tile or panel works well because leaders can scan it in seconds and know where to look first.
| Category | Metrics Included |
|---|---|
| Coverage & Integrity | Log Completion Rate, Log Integrity Verification Rate |
| Monitoring Speed | Review Cycle Time, Report Turnaround Time |
| Exception & Gap Management | Exception Count, Unresolved Gaps |
| Access Oversight | Access Change Volume |
| Evidence Readiness | Retention Compliance Rate |
Each tile should expand into charts and drill-down filters by business unit, system, and regulatory scope. That way, the top-level view stays clean, but teams can still dig into the details when a tile turns yellow or red.
Ownership matters here. For each category, assign:
Once those roles are clear, set alert thresholds and review cadences by category. Use the thresholds already defined for each metric as the dashboard's alert triggers.
Review cadence should match how fast the risk can change. Operational metrics like Log Completion Rate, Exception Count, and Access Change Volume need daily or near-real-time review. Governance metrics like Review Cycle Time and Retention Compliance Rate usually fit better into weekly controls reviews and quarterly review packages. When those review cycles line up with your reporting calendar, it becomes much easier to use dashboard output in board and investor reporting.
For growth-stage companies, Phoenix Strategy Group can help connect these metrics to FP&A and management reporting.
These metrics turn logging into evidence. Collecting logs is the starting point, not the finish line.
Strong audit trail compliance means you can prove your records are complete, reviewed on time, protected from tampering, retained the right way, and ready when someone asks for them. That’s a much higher bar than just having a logging system switched on.
Taken together, these eight metrics cover completeness, timeliness, risk detection, integrity, and retention. When all eight are in good shape, you can show audit readiness to regulators, external auditors, and investors with confidence - not just say you have it.
They also give leaders a clearer way to support SOX, move audits along, cut down on adjustments, and contain control failures before they turn into findings.
A simple 90-day path looks like this:
That’s when the dashboard stops being just a reporting tool and starts working like a control tool.
Phoenix Strategy Group can help growth-stage companies turn these metrics into executive reporting, FP&A, and audit-ready documentation.
Start with the core metrics that show how healthy your financial controls are and where your compliance status stands:
From there, watch issue response speed, internal audit finding remediation rates, access change volume, and audit response time. These metrics help you see how fast teams fix gaps and how audit-ready the business stays as it grows.
Set targets that match both compliance demands and the way your business runs day to day. Start with a risk assessment, map your workflows, and use frameworks like COSO as a guide when setting benchmarks.
Then define achievable, risk-weighted KPI targets for metrics such as error rates, exception counts, and reconciliation timelines. Track them with real-time dashboards, and review them on a regular basis as rules shift and your business changes.
Use a central system that pulls data from your core business infrastructure. The main sources usually include application services, identity systems, database audit logs, API gateways, ETL/ELT pipelines, and cloud infrastructure logs.
It also helps to bring in internal records like training completion data, incident reports, policy exception logs, and documentation change records. When you put these pieces together in one place, you get a complete compliance evidence trail.