Published on
August 30, 2026


What-if modeling helps me test big decisions before I commit money, time, or headcount. It is most useful when a few inputs - like price, churn, staffing, demand, or timing - can change revenue, cash flow, margin, or runway in a big way.
Here’s the short version:
A few numbers show why this matters:
The main lesson is simple: I should focus on the 3 to 5 inputs that move the model the most, then compare best case, base case, and downside case before making a call.
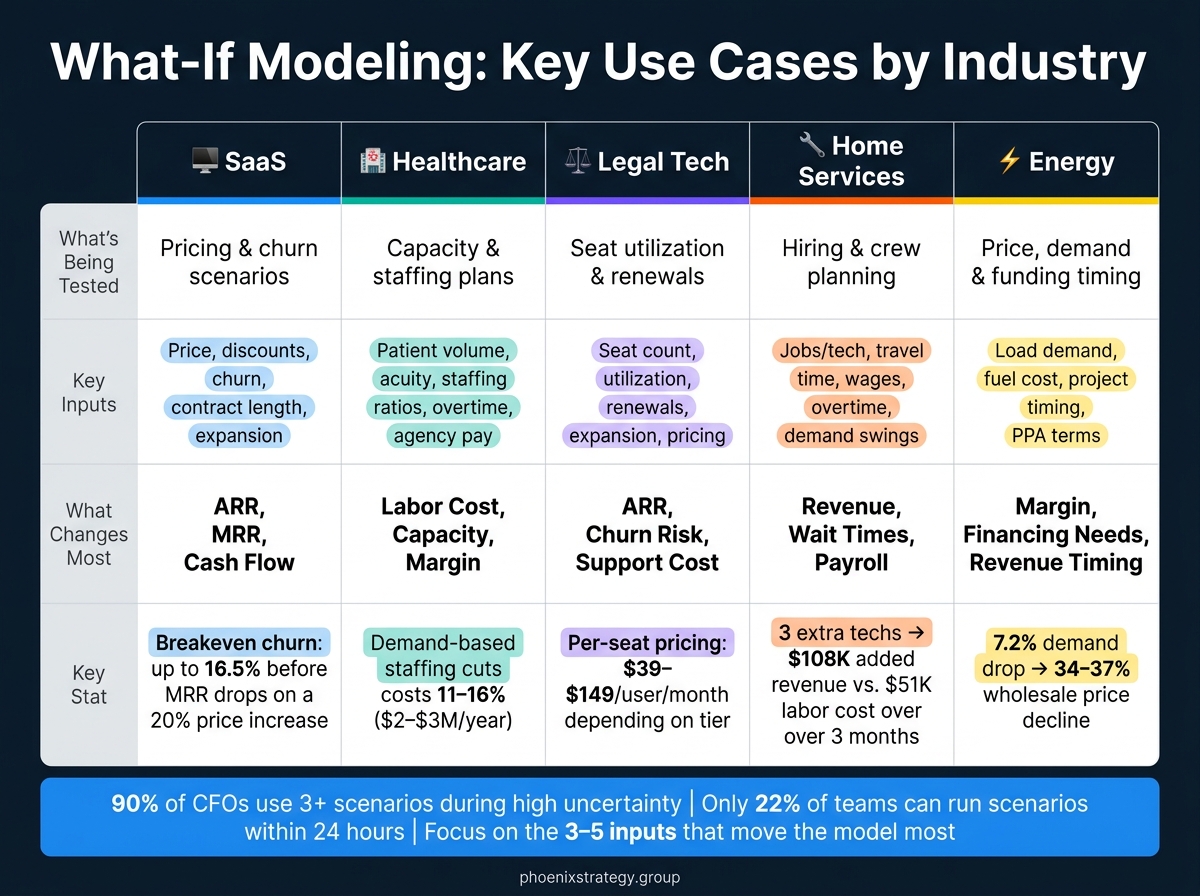
What-If Modeling Use Cases: Key Inputs & Financial Impacts by Industry
| Use case | What I’m testing | Main inputs | What changes most |
|---|---|---|---|
| SaaS | Pricing changes | Price, discounts, churn, expansion, contract length | ARR, MRR, cash flow |
| Healthcare | Capacity planning | Patient volume, acuity, staffing ratios, overtime, agency pay | Labor cost, capacity, margin |
| Legal tech | Seat economics | Seat count, utilization, renewals, expansion, pricing | ARR, churn risk, support cost |
| Home services | Hiring and crew planning | Jobs per tech, travel time, wages, overtime, demand swings | Revenue, wait times, payroll |
| Energy | Price and funding timing | Load demand, fuel cost, project timing, PPA terms | Margin, financing needs, revenue timing |
If I want better planning with fractional CFO services, this is the core idea: run a small set of scenarios around the inputs that hit cash and timing the hardest.
For SaaS companies, pricing decisions come with real risk. Move prices up too fast and churn can climb. Keep prices flat and you leave ARR on the table. A pricing change can push ARR up or set off customer losses, which is why scenario modeling matters so much. It helps teams see which path looks more likely before they flip the switch.
The core question is simple: How will a pricing change affect churn, net revenue retention (NRR), and cash flow?
Teams usually test a few common scenarios:
Each one can lead to a very different ARR path and cash-flow picture.
A solid SaaS pricing model changes inputs across a handful of key levers: price by tier, discount rate, contract term, logo churn by segment, and expansion revenue.
Customer size matters here. A small business buyer and an enterprise buyer rarely react the same way to higher prices. That’s why segmentation can’t be an afterthought. Enterprise SaaS often keeps annual churn below 3%, while SMB products often land in the 10%–15% range.[2][3]
One useful metric is the breakeven churn rate. That’s the maximum churn a price increase can absorb before MRR starts to fall.
Here’s a simple example. If a company has 200 customers paying $50 per month, it starts at $10,000 MRR. If it lifts price to $60 per month, it can lose up to 33 customers, or 16.5% churn, before revenue drops below the starting point.[4] Putting that threshold into the model gives teams a clear line in the sand before any pricing update goes live.
The numbers also make timing and messaging easier to judge. Grandfathering existing customers during a price increase can cut immediate churn by 67%, but it also reduces the expected revenue lift by about 23%.[5] That tradeoff is easy to miss if you only look at headline price changes.
When a pricing scenario points to solid ARR growth and stable enterprise churn, it can change more than the revenue plan. It can shift hiring timing and even the fundraising window. Phoenix Strategy Group works with growth-stage SaaS companies to tie pricing assumptions to runway and headcount plans, which connects directly to healthcare capacity scenarios.
If pricing scenarios shape revenue predictability, healthcare scenarios answer a more urgent question: can operations handle demand safely? Hospitals run with thin margins and uneven volume. A flu spike, a staffing gap, or a sudden jump in ED visits can push a facility past safe limits fast. What-if modeling gives clinical and finance teams a way to pressure-test demand, staffing, and capacity before that happens.
The core question is simple: How many staffed beds and clinical FTEs will cover projected patient volume over the next 12–24 months?
That usually turns into a few concrete choices. Should the hospital open a new 20-bed unit? Add 10 ICU beds? Extend clinic hours into the weekend?
A common scenario looks like this: if average daily census in the med–surg unit rises from 120 to 135 patients, will the hospital need more RN and CNA FTEs on each shift to stay within target nurse-to-patient ratios? That’s the kind of issue leaders need to answer before volume climbs, not after.
These models usually adjust a tight set of operating and cost inputs:
Here’s a plain example. ED visits rise 15%. LOS goes up by 0.3 days. The nurse ratio tightens from 1:5 to 1:4. Travel nurse pay lands at 1.8x base. Run that mix through a model, and leadership can see the cost and capacity effect before signing any contracts.
The dollars add up fast.
A Columbia Business School research brief found that demand-based ED staffing can reduce staffing costs by 11–16%, or $2–$3 million per year, while maintaining timely access to care[10][11]. A workforce AI model for anesthesia staffing reached 92% predictive volume accuracy, was 21% more efficient at meeting demand than older models, and found $1.9 million in annual savings by cutting staffing by 5.25 CRNA resources per day[12].
Scenario modeling also makes trade-offs harder to ignore. Travel nurses often cost 1.5–2.0x base pay, but trying to avoid that cost through overtime or understaffing can lead to diversions and lost elective surgeries[6][1][7]. That’s where the model earns its keep. It shows when labor costs point to earlier hiring, delayed expansion, or a funding gap - and gives leaders a much stronger case when they bring that plan to the board.
Midland Memorial Hospital in Texas used predictive analytics to line up patient acuity and volume with nurse skills and capacity. The result was a 32% drop in overall nursing turnover and a 43% drop among newer nurses, along with lower labor costs[8][9].
For growth-stage health systems, Phoenix Strategy Group ties staffing scenarios to funding timelines and financial models.
The same input discipline matters just as much in legal tech, where revenue depends on seat utilization and expansion timing.
Legal tech companies live and die by seat economics. When seats sit unused, renewals get shaky. When more seats are active, expansion gets easier. That’s why utilization is the main forecasting lever here, not just raw seat count. What-if modeling helps teams pressure-test renewals at the same time they test pricing.
The main question is simple: does the current seat mix drive the most revenue without pushing churn up?
A few choices usually sit on the table:
Say a legal tech vendor wants to test ARR impact from moving its mid-market segment from a 20-seat minimum to a 50-seat minimum. Or maybe it adds 20 lite seats at $1,200 each alongside 40 full seats priced at about $4,000 per year. Those are the kinds of changes this model is built to evaluate.
A useful what-if model changes inputs at both the firm and segment level. The main variables are average seats per firm by segment, seat utilization rate, average annual price per seat, discount levels by firm size or contract length, logo and seat churn rates, and expansion rates for current accounts. Sales velocity matters too, since conversion rates shape how fast new seat revenue shows up. Together, these inputs show whether seat revenue is likely to grow or flatten across cohorts.
Here’s a concrete example. A matter management vendor selling to mid-market firms might run three scenarios:
These models usually surface a plain tradeoff. Higher seat minimums lift short-term ARR, but they can also increase churn risk for smaller firms that won’t use all the licenses. Lite seats bring down average revenue per full seat, but they can spread adoption across the firm and make renewals stickier over time.
Higher seat utilization also tends to improve upsell rates. That’s tied less to how many seats a firm buys and more to whether people actually use the platform. On the cost side, these scenarios show how more seats change onboarding and support needs, which then feeds into gross margin projections. Typical per-seat pricing across U.S. legal tech platforms runs from about $39 to $149 per user/month depending on tier, which gives vendors a broad range to model against [13][14].
For growth-stage legal tech companies, what-if models help with funding-readiness decisions, especially runway and raise timing. If the model shows strong seat utilization, steady renewal rates, and healthy expansion ARR across firm cohorts, leaders get a much clearer picture of how long cash lasts and when to go out for the next round.
Phoenix Strategy Group helps legal tech businesses build these scenario frameworks by pulling together usage data, billing records, and CRM inputs into FP&A models that tie seat utilization directly to funding readiness and renewal durability.
That seat-utilization lens shifts next to crews and job slots in home services.
Home services teams use what-if modeling to figure out when to hire, add crews, or extend hours without squeezing margins. The same model that helps protect service levels can also show when a hiring move will put pressure on cash flow.
The main call is simple: add capacity before demand spikes, or wait until the schedule is full. That often leads to a few related choices too, like whether to add a crew or lean on overtime, expand into new ZIP codes, or keep the team working later.
For an HVAC company in the Midwest, this matters a lot. Summer demand can triple versus baseline months when temperatures rise above 90°F [15]. When demand swings that hard, timing is everything.
And this isn’t just about jobs already booked. It also depends on demand that’s still sitting in the pipeline.
A good home services what-if model changes inputs across booked work, weighted quotes, and seasonal demand. The main operating inputs usually include:
A common target is 75%–80% technician utilization. Once utilization moves above 85%, that’s often a sign the business needs to hire or add capacity [15].
Here’s a clear example. An HVAC company heading into summer models two paths. Scenario A keeps headcount flat. That pushes utilization to 95%, stretches wait times to 3–4 days, and increases cancellations by 15%. Scenario B adds three technicians in May at about $17,000 per month in added payroll, keeps utilization near 80%–85%, cuts wait times to under 48 hours, and brings in about 20 extra jobs per week - or roughly $9,000 in added weekly revenue.
Over a three-month season, that works out to about $108,000 in added revenue against $51,000 in added labor cost [15]. At that point, the model gives management a direct choice: hire now, absorb overtime, or hold off on expansion.
Hiring a technician increases payroll. But tighter routing and stronger utilization can help cover part of that cost. Just as important, what-if models show the cost of not hiring.
Longer wait times often lead to more cancellations. And those cancellations don’t just hurt this week’s revenue. They can also mean fewer repeat customers later and weaker online ratings. A model can put numbers around those tradeoffs by using assumptions tied to repeat purchase behavior and referral rates [15].
A rolling 13-week cash forecast tied to booked work and seasonal demand gives lenders a clearer picture of hiring needs and runway. That shifts hiring from a reactive scramble to a forward-looking plan.
In energy, the same scenario logic moves from crews to price, demand, and funding timing.
Home services planning tends to revolve around crews and utilization. Energy planning is a different beast. Here, the big variables are price, demand, and financing windows.
And those numbers can swing hard.
Weather changes demand. Fuel costs move margins. Policy shifts can change project economics overnight. Long build cycles add another layer of risk. That’s why what-if modeling matters so much in energy. It lets teams test pricing, demand, and funding choices before they lock in capital.
The main decisions usually land in three buckets: how to price electricity, how much demand to plan for, and when to close funding.
In practice, teams often test:
Good energy models don’t change one variable at a time. They test price, demand, fuel costs, and project timing together, because that’s how the business works in the field.
Southern California Edison is a good example. The company identified 45 scenarios based on eight key factors, including fuel prices, demand, environmental regulation, customer-owned solar, and population growth, before narrowing them to 12 scenarios for analysis [17].
Demand assumptions, in particular, can have an outsized effect on pricing.
In one lower-demand scenario, when hourly demand fell by about 3.5%, average wholesale power prices dropped 15% to 18%. In a steeper case, a 7.2% demand decline pushed prices down 34% to 37% [16].
That’s a big move from a small shift. It also shows why demand is one of the highest-leverage inputs in any energy pricing model.
For renewable developers, the timing of funding is often where the model starts to pay off.
PPA negotiations usually take 6–12 months, and utility-scale solar projects often need 1 to 2 years between PPA signing and commercial operation [18]. So even a single delay can ripple through the whole deal.
A 6-month construction delay can:
Running these scenarios before financial close gives developers a clearer view of how much bridge financing or working capital buffer they may need.
Phoenix Strategy Group helps growth-stage energy companies connect pricing, demand, and funding timing in one model.
The next step is choosing only the inputs that materially move cash, capacity, or timing.
After you’ve tested the main use cases, tighten the model around the few inputs that actually change cash, capacity, or timing. In most cases, that means focusing on the 3 to 5 assumptions behind most of the forecast swing, then changing one input at a time to see what hits revenue, margin, and cash the hardest.[22][20]
Small changes can have a big effect. A 2-point shift in churn, a 5% price change, or a one-month delay in a key hire can move revenue, operating profit, and cash runway in a big way. If an input changes those outputs more than the rest, it belongs in your core scenario set.[22][20]
The right inputs depend on the business model:
For growth-stage companies, runway and funding milestones need extra focus. Hiring plans, pricing changes, and growth spend can shift both. A common rule is to start fundraising when you have about 12 months of runway left, so you can line up capital with key milestones from a stronger position.[19]
Once those drivers are nailed down, teams can build cleaner forecasts and make better capital plans. Phoenix Strategy Group works with growth-stage companies to turn those drivers into driver-based financial models, FP&A workflows, and scenario plans built for fundraising, linking operating metrics to cash flow and investor-ready outputs.
The best use cases for what-if modeling software share one thing: a small set of uncertain inputs tends to drive most of the financial outcome. In SaaS, healthcare, legal tech, home services, and energy, that pattern shows up again and again.
That’s why scenario planning matters across very different business models. It lets teams see how changes in pricing, staffing, timing, and funding can affect cash flow, margins, and runway before leaders make the call. According to a McKinsey survey, 90% of CFOs were using at least three scenarios to support planning during periods of high uncertainty.[26] Put simply, this kind of work helps teams move faster and back up decisions with numbers.
To get that value on a steady basis, treat what-if modeling as a habit, not a one-off project. When it becomes part of quarterly forecasts and board decks, decisions can happen in days instead of weeks.
Phoenix Strategy Group helps growth-stage companies turn scenarios into investor-ready financial models and FP&A workflows tied to cash flow.
Choose inputs that have a direct link to each revenue line and that the right teams can track. Start with your main revenue metric. Then break revenue into clear lines and map 3–5 drivers to each one.
That might include:
The goal is simple: each input should be easy to measure and tied to a team that can affect it.
Use clean historical actuals as your starting point. Back-test the model against prior months to see how well those inputs explain past performance. Also, keep assumptions in one dedicated area with clear definitions, data sources, and owners. Update that section at least monthly so the model stays grounded in what the business is doing now.
Use these cases to stress-test your financial model instead of leaning on a single forecast.
Update them on a recurring schedule: monthly at minimum, with quarterly updates to keep multiple active scenarios in line with market conditions and internal performance.
If you use a driver/ARR workflow, refresh assumptions mid-month after closing the books, then publish the rolling forecast soon after. If results drift by about 5%–15%, or if a major event hits like a product launch or pricing change, update sooner.



