Published on
August 10, 2026


If your net burn stays above 10%–20% of annual revenue and runway is under 12 months, I’d treat it as a near-term cash problem. The fix is simple in concept: I’d stop looking at revenue alone and start tracking contribution margin, CAC payback, break-even MRR, and months of runway in one monthly model.
Here’s the short version:
A few numbers from the article make the point fast:
I’d use those numbers to answer four plain questions every month:
Here’s the core view:
| Metric | What I’d use it for | Warning sign |
|---|---|---|
| Net Burn | Track monthly cash loss | Burn stays high while revenue grows |
| Runway | See months left before cash runs out | Under 12 months |
| Contribution Margin | Measure how much each sale helps cover fixed costs | Under 30% |
| CAC Payback | Check how long cash stays tied up | Over 18–24 months |
| LTV:CAC | Test acquisition quality | Under 2:1 |
| Break-Even MRR | Set the revenue target for cash safety | Moving up each month |
So if I had to sum up the article in one line, it would be this: I’d treat break-even as a monthly cash control tool, not a finance exercise.
Below, the article walks through how to build that model and use it to test price changes, cost cuts, hiring, and growth plans before runway gets too short.
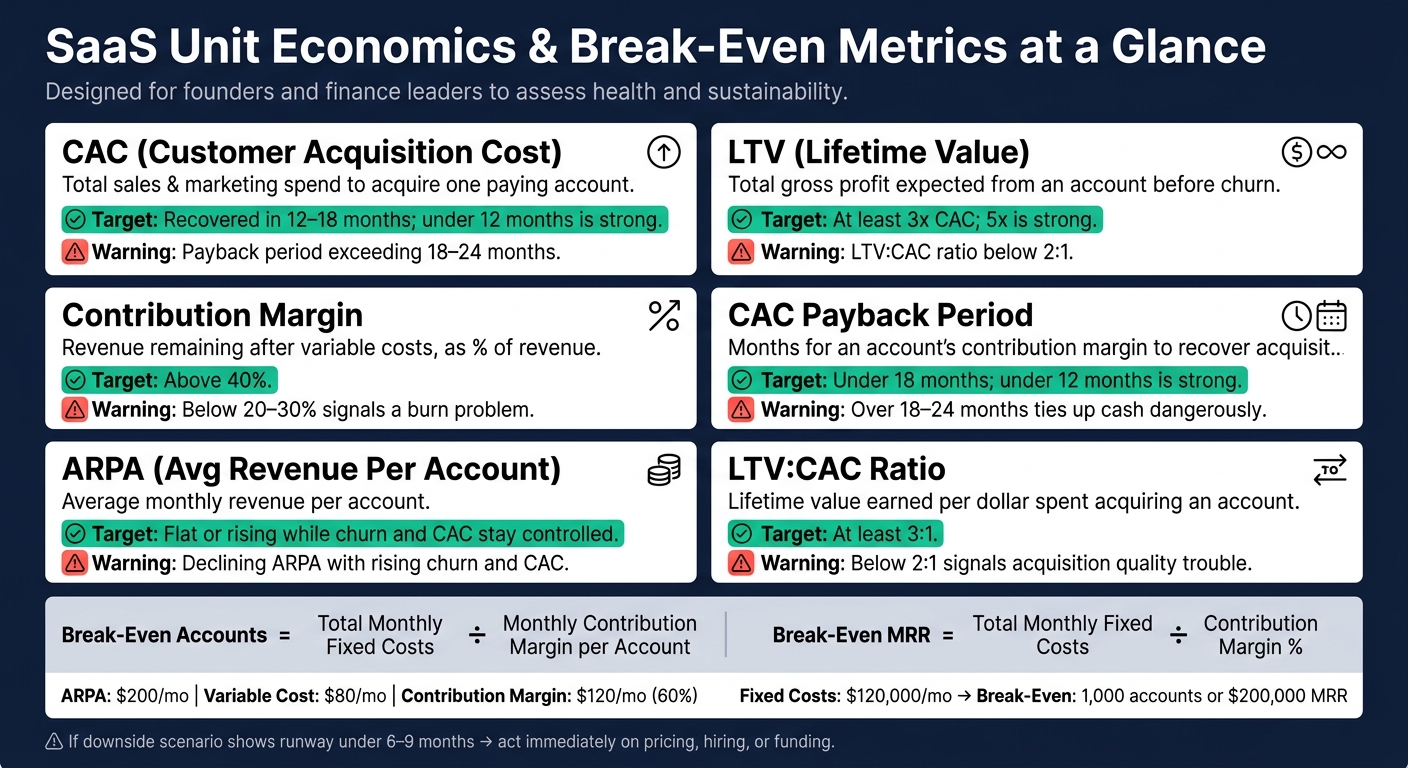
Key SaaS Unit Economics Metrics: Definitions, Targets & Warning Signs
If you want to fix cash burn, you have to look at the business one account at a time.
That’s where unit economics comes in. These numbers show what each account costs to win, what it earns over time, and how much it adds toward keeping the business alive. They also feed straight into the break-even model in the next section.
| Metric | Plain-English Definition | Typical Target Range |
|---|---|---|
| CAC (Customer Acquisition Cost) | Total sales and marketing dollars spent to recover one new paying account. | Recovered in 12–18 months; under 12 months is strong. |
| LTV (Lifetime Value) | Total gross profit expected from an account before they churn. | At least 3x CAC; 5x is strong. |
| Contribution Margin | Revenue left after variable costs, as a percentage of revenue. | Above 40%; below 20–30% is a burn warning. |
| Payback Period | Months for an account's contribution margin to recover acquisition cost. | Under 18 months; under 12 months is strong. |
| ARPA | Average monthly revenue per account. | Should stay flat or rise while churn and CAC stay controlled. |
| LTV:CAC Ratio | Lifetime value earned for every dollar spent acquiring an account. | At least 3:1; below 2:1 is trouble. |
There’s a simple relationship here. Higher ARPA and lower churn push LTV up. Lower variable costs improve contribution margin. And when those two things move in the right direction, payback gets shorter and runway lasts longer.
Once you can read these metrics, you can turn them into a break-even and runway view. At that point, burn stops being a vague money problem and becomes a math problem: How much revenue and margin do you need to stop losing cash?
The starting point is contribution margin per account. Everything builds from that.
Say your ARPA is $200/month and your variable costs per account, like hosting, support, and transaction fees, come to $80/month. Your contribution margin per account is $120/month, or 60%.
From there, the formulas are pretty direct:
Here’s what that looks like in practice. A company with $120,000/month in fixed costs and $120/month in contribution margin per account needs 1,000 accounts to break even at the operating level.
That same company needs $200,000 in MRR ($120,000 ÷ 0.60) to cover its fixed cost base.
If the business is sitting at $80,000 MRR today and adding $20,000 per month in net new MRR, it gets to break-even MRR in about 6 months - assuming costs stay flat.
That months to break-even figure is where unit economics meets runway. It tells you if your current pace gets you to safety before the bank account becomes the problem.
The first signs of trouble usually show up here, before cash feels tight day to day.
Low or falling contribution margin is often the first warning. If contribution margin drops below 30%, new revenue can actually make operating losses worse. Each new sale puts less money toward fixed overhead, so growth starts working against you.
The next red flag is a long CAC payback period. When payback moves past 18–24 months, the business is fronting the cost of each account for a year and a half or longer. That puts real pressure on cash, especially when capital markets tighten.
Then there’s weak retention, which makes both problems worse. High monthly churn - above 3–5% for B2B SaaS - drags down LTV fast. And once LTV falls, the LTV:CAC ratio weakens too, even if CAC looks fine on its own.
Another warning sign is when fixed costs outpace gross profit. Headcount, tooling, and overhead keep climbing, but contribution margin doesn’t keep up. Break-even moves farther away, even while revenue is still growing.
That’s the point where these metrics stop being dashboard numbers and start becoming survival numbers.
Break-even metrics only help if they feed a monthly model. The goal is simple: see when cash runs out and what changes that date. A solid model links income, cash timing, and runway, so shifts in customers, pricing, churn, payroll, and collections show up across profit, cash burn, and runway at the same time.[12][13][14][16]
Start with operating assumptions, not just finance line items. Build the model from the ground up: customers first, then revenue, then costs, then cash.[13][14][17][18]
For a subscription business, monthly revenue should begin with the opening customer base, then add new customers, subtract churn, and apply pricing and expansion assumptions. Say you start the month with 500 customers, add 40, lose 15 to churn, and move ARPA from $100 to $104 through a price increase or upsell. The forecast should show each of those moves clearly, not bury them in one revenue number.
On the cost side, variable costs should move with volume instead of sitting there as a flat monthly amount. Payment processing fees, hosting, and customer support labor should all climb as customer count climbs. Headcount also needs its own schedule. Model each role by start date, fully loaded cost, and ramp time. If you hire three engineers in May but they do not ship product until July, the model should show the cash burn right away while pushing the revenue impact out.
Once the base model works, build at least three scenarios from the same shared drivers. The base case reflects the current plan. The upside case might assume better pricing, lower churn, higher conversion, or more expansion revenue. The downside case is the one to watch most closely. Test what happens if CAC goes up 20%, churn moves from 3% to 5%, a key hire starts earlier than planned, or collections slow down.[1][4][6][7][9][10]
Each scenario should output:
If the downside case shows runway falling below six to nine months, that's the cue to act. Maybe you adjust pricing, pause a hire, or start a funding conversation or consult a fractional CFO before cash pressure gets tight.[11][12][15]
Update the model every month. Swap the prior month's forecast for actual results, explain the variances by driver - was gross margin lower because of discounting or vendor cost increases? - and then roll the assumptions forward.[2][3][5][8][10] That's how a spreadsheet stops being a static file and starts helping with day-to-day decisions. Use that monthly update to figure out whether price, spend, or hiring changes runway the fastest.
Once you update the model each month, use it before you commit cash. That means testing pricing, spend, and hiring in advance instead of making the call on instinct. Break-even month and runway should be the first screens for every pricing, spending, and hiring choice.
Once break-even month and runway are in view, the next step is simple: figure out which lever changes them fastest.
Price floor = all per-customer variable costs + fixed costs ÷ realistic monthly customers.
Here’s what that looks like in practice. If fixed costs are $150,000 per month and you can realistically serve 1,500 customers, each customer needs to contribute $100 just to cover fixed costs. Add $45 in variable cost per customer, and your price floor lands at $145 per month. Go below that, and you’re burning cash on every sale.[19][20][21]
Before you touch list price, test packaging and contract changes in the model. In many cases, that gets you better margin without changing the base sticker price. A few common moves:
Each of these changes should show up in the model as higher contribution margin per customer and fewer customers needed to break even.
Cut spending that does neither of two things: improve unit economics or drive profitable growth inside payback. In the $500,000 to $10 million revenue range, the first places to look are often overlapping SaaS tools, underused contractor retainers, and brand or PR spend with no clear tie to revenue. A $10,000 per month reduction in non-core software can lower break-even units with almost no hit to revenue. On the other hand, cutting a product engineer who is working on churn reduction or self-serve onboarding might save $15,000 per month now and cost much more through weaker unit economics over the next 6 to 12 months.[19]
| Lever | Effect on Contribution Margin | Effect on Break-Even Units | Effect on Cash Runway |
|---|---|---|---|
| Raise Price | Increases margin per unit directly | Decreases units needed to cover fixed costs | Improves cash per sale |
| Reduce Variable Cost | Increases margin per unit by lowering per-unit costs | Decreases units needed to cover fixed costs | Improves cash per sale |
| Reduce Fixed Cost | No direct impact on unit margin | Decreases total units needed to reach break-even | Lowers monthly burn |
A practical sequence helps here. Start with reversible, non-core cuts. Then move to longer commitments like vendor contracts or leases. Headcount should come after those two layers, because those choices are harder to undo and carry the biggest risk to growth capacity.[19]
After cost cuts, run every new expense through the same runway model.
Every hire and every channel test should clear the model before approval. Take a U.S.-based sales rep with a $90,000 base salary, $40,000 in expected variable comp, and a 25% benefits load. The fully loaded monthly cost is about $13,500. Your model should show when that rep is likely to ramp - usually three to six months - and how much new ARR bookings that rep can bring in at your current gross margin. Approve the hire only if the downside case still leaves enough runway after ramp and payback.
Use the same standard for marketing. A $20,000 per month channel test needs a modeled payback period tied to realistic conversion rates and contribution margin per closed deal, not just pipeline hopes. Put each approval through the model so the runway hit is clear before the offer letter goes out or the contract gets signed.[19]
Once the model is built, the hard part is the weekly and monthly review.
Cash burn usually starts as a unit economics issue. If contribution margin is weak, cash can disappear even while revenue keeps climbing. That’s why break-even should be treated as a monthly operating metric, not a one-and-done spreadsheet task. Teams that watch it every month are far more likely to spot trouble before it gets expensive.
Track break-even from three angles:
Taken together, those views make it easier to see whether pricing, spending, or growth is extending runway or eating into it.
Build break-even into your monthly operating model, not just the annual budget. As actual results come in, the model should show whether pricing, volume, or spending is pushing break-even farther out or pulling it closer. It should also include base, downside, and upside scenarios, with action thresholds tied straight to the numbers.
Measure contribution margin with care. Split out hosting, payment processing, support, and onboarding costs from fixed overhead. If those costs are buried in the wrong place, break-even can look closer than it is, and runway can seem safer than it actually is.
Phoenix Strategy Group helps growth-stage companies connect bookkeeping, FP&A, fractional CFO support, data engineering, and integrated modeling so burn, margin, and runway stay visible in one operating view.
Treat break-even as a live monthly metric that shows how far you are from profitability and what is moving it. That shift makes break-even part of how the business runs day to day, not just a one-time analysis.
Cash break-even is the point where sales bring in just enough revenue to cover total operating costs. At that stage, the business is no longer losing money, but it isn’t earning a profit yet either.
It depends on fixed costs and contribution margin, which is the revenue left after variable costs are paid. If the variable cost per unit is more than the selling price per unit, break-even can’t happen unless the business changes its costs, its pricing, or both.
CAC payback tells you how many months of profit it takes to earn back what you spent to win a new customer.
Use this margin-adjusted formula: CAC ÷ (monthly recurring revenue per customer × gross margin %).
To get CAC, divide your total sales and marketing expense by the number of new customers you acquired during the period. Then plug in your monthly recurring revenue per customer and gross margin percentage.
First, make sure your financial records are accurate and up to date. If the numbers are incomplete or old, you're not making a decision - you’re making a guess.
Then fix contribution margin first. It needs to be positive so each sale covers variable costs and helps pay fixed expenses. If it’s zero or negative, change your pricing, cut variable costs, or lower fixed expenses.



