Published on
September 13, 2026


Strong sales do not pay bills on time - cash timing does. If I run a seasonal business, I need to map when cash comes in, when it goes out, and where the gap shows up before peak season or slow months hit.
Here’s the short version:
A few numbers make the risk clear:
If I want fewer surprises, I need a forecast that shows when cash gets tight, not just whether the business looks profitable on paper. That is what this process is built to do.
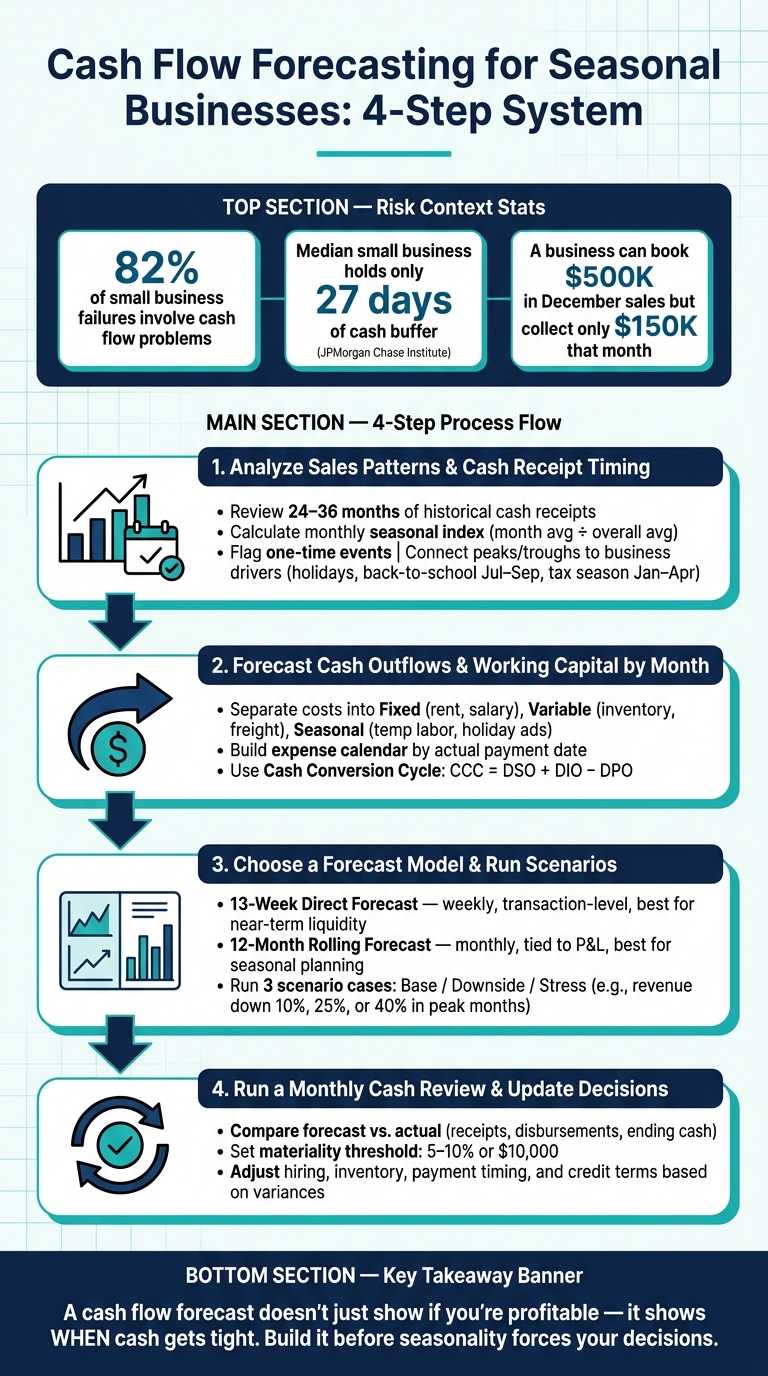
Cash Flow Forecasting for Seasonal Businesses: 4-Step System
Start with 24–36 months of historical cash receipts, not accrual revenue, and group the numbers by month in U.S. dollars. Pull this data from your bank records or accounting system, and keep it separate from accrual revenue figures. Then turn those raw receipts into a monthly seasonality view. [7][13]
Work out each month's seasonal index by dividing that month's average receipts by the overall monthly average. Include transition months too, not just the obvious high and low points. Those in-between months often show when cash is starting to build or taper off. An index above 1.0 signals a peak. Below 1.0 points to a trough. [8][9][10][11]
Here’s a simple example. If your overall average monthly receipts are $400,000 and your average November receipts are $520,000, your November seasonal index is 1.30. If January comes in at $320,000, the index is 0.80.
Plot those indices across the full historical period in a basic line graph. That makes the pattern easy to spot. You’ll see which months tend to be cash-heavy and which ones are more likely to feel tight.
Historical data can get messy fast. One unusual month can throw off the whole picture, so flag any month driven by one-time receipts before you use it as a baseline. [7][9][11]
Say $350,000 of a $900,000 October came from a one-off project that isn’t coming back. In that case, your recurring October baseline is closer to $550,000, not $900,000.
Write down every adjustment and the reason behind it. That paper trail matters. It makes the forecast easier to defend, easier to revisit, and much easier to update later. After that, connect each pattern to the business activity behind it.
Seasonal indices show what is happening. Business drivers explain why. That’s the part that turns a spreadsheet into something you can use.
For U.S. companies, common drivers include:
Match each peak and trough to its driver so you can update the forecast when conditions change. If a major trade show moves to a new month, or a mild winter cuts seasonal demand, you can adjust the months tied to that shift. Your marketing calendar, renewal schedule, and event plan all feed monthly cash inflows straight into the forecast model. [6][13]
Take the monthly demand pattern from Step 1 and use it to map the cash outflows that come next. The goal here is simple: track when cash actually leaves the business, not just when sales show up on paper. The peak and slow months you already found should now line up with spending jumps, inventory build-ups, and supplier payments.
Start by tagging each expense in your forecast model as fixed, variable, or seasonal. Fixed costs are your steady monthly bills. Variable costs move up and down with sales. Seasonal costs tend to jump before and during busy periods. [14][15][16][4][18]
| Cost Category | Examples | Behavior |
|---|---|---|
| Fixed | Rent, salaried payroll, insurance, SaaS tools, debt service | Flat month to month |
| Variable | Inventory, freight, commissions, payment processing | Rises and falls with sales volume |
| Seasonal | Temp labor, holiday ad campaigns, peak-period warehousing | Spikes before and during peak demand |
This split matters because not every dollar behaves the same way. Rent usually stays put. Inventory and freight can swing hard. Temp labor and holiday ads often hit before the sales bump does, which is where many cash forecasts go sideways.
An income statement shows accruals. A payment calendar shows cash timing. That's the difference that matters here.
Convert accrual timing into payment timing month by month. Build a spreadsheet that logs each major outflow by its actual due date, not its accrual date. [14][4][19][20]
Include items like:
When you lay this out month by month, you often spot something uncomfortable but useful: cash can leave the business well before revenue comes in. [14][4][19][20]
Use three working capital metrics as inputs in the monthly model: Days Sales Outstanding (DSO), Days Inventory Outstanding (DIO), and Days Payable Outstanding (DPO). [17][1][21][22]
Here’s what that looks like in practice. If your DSO is 45 days and you book $400,000 in November credit sales, most of that cash probably won’t land until late December or early January. If DIO climbs from 40 to 70 days while you build pre-holiday inventory, cash sits in stock for about 30 extra days. And if your DPO is only 30 days, you’re paying suppliers faster than customers are paying you. [17][1][21][22]
The formula that pulls this together is the Cash Conversion Cycle (CCC = DSO + DIO − DPO). It shows how long cash stays tied up across receivables, inventory, and payables before it comes back into the business. [17][1][21][22]
Use DSO, DIO, and DPO to pressure-test how collection speed, inventory levels, and supplier terms affect month-end cash. Those timing assumptions carry straight into the forecast model in Step 3.
Take the cash timing gaps from Step 2 and plug them into the forecast model that fits your time frame and cash risk.
Build a 13-week direct cash forecast by week. Use your current bank balance after reconciliation, expected receipts, and scheduled payments. The rows should cover customer receipts, vendor payments, payroll, taxes, debt service, rent, and other scheduled payments. You begin with the current bank balance and roll it forward week by week. [25][2][30][31]
This model is a good fit when cash is tight or hard to predict. Say you're heading into a big inventory build for holiday sales, adding seasonal staff, or dealing with slower customer payments. A 13-week forecast shows whether cash will cover what you owe before the next wave of revenue comes in. [24][25][26][27]
Update it every week. Swap last week's forecast for actual bank activity, add a new week at the far end, and revise the weeks in between based on updated AR aging or new commitments. If actual weekly results don't replace old assumptions, the model loses its value fast. [25][2][39]
A 12-month rolling forecast ties revenue, gross margin, operating expenses, and working capital changes into monthly cash flow. Each month, remove the month that just finished and add a new one at the end, so you always keep a live 12-month view. [29][32][33][34]
Use it to plan hiring, inventory, marketing, and credit-line timing. Bring in the working-capital assumptions from Step 2 to estimate how AR, inventory, and payables move from month to month. Set a cash reserve target, usually measured in weeks of payroll and fixed expenses, so you go into slower periods with a defined buffer instead of a guess.
Run both models side by side: one for near-term liquidity and one for seasonal planning. [23][24][26][27][28]
| Direct (13-Week) | Monthly Rolling (12-Month) | |
|---|---|---|
| Time horizon | 4–13 weeks | 12–24 months |
| Detail level | Weekly, transaction-level | Monthly, tied to P&L and balance sheet |
| Data inputs | AR/AP aging, bank data, payroll schedule | Revenue forecast, margins, working capital assumptions |
| Update frequency | Weekly or daily | Monthly |
| Best use case | Near-term liquidity, inventory builds, slow collection periods | Staffing, seasonal planning, financing decisions |
Once the base model is in place, pressure-test the months most likely to cause trouble. Set up three cases - base, downside, and stress - and run each one through both forecasts. [35][37][38][40][41]
For seasonal businesses, common stress tests include:
Each scenario should lead to a clear output: how low cash drops, and what action that result triggers - freezing hiring, drawing on a credit line, or delaying a purchase order. [35][36][40]
Phoenix Strategy Group helps growth-stage companies build forecasting setups that link near-term and seasonal models into one cash decision framework.
A monthly cash review keeps your forecast current. It does that by comparing planned cash with actual cash, then turning any gap into action. This is the moment where your assumptions meet reality.
Start with actual cash movement for the month. Then compare each line item against the forecast.
Pull these figures first:
Line those numbers up against both your 13-week and 12-month forecasts. For each line, calculate the variance in dollars and as a percentage. Say customer receipts came in at $280,000 against a $250,000 forecast. That’s a +$30,000 / +12% variance, and it deserves a closer look.
Break receipts and disbursements into key categories like customer receipts, payroll, inventory, taxes, and marketing/advertising. This matters even more during peak build months and slower collection months. If you group cash movement this way, you can see where the forecast went off track instead of staring at one big number and guessing.
Ending cash variances matter most when you isolate the cause. Was it slow collections? A large inventory purchase? Taxes? Payroll? Set a materiality threshold so the team stays focused on what matters most. A common range is 5% to 10% or $10,000.
Once you find the gap, change the operating decision behind it. That’s the whole point of the review. If nothing changes after the numbers come in, the review turns into paperwork.
If collections stretch from 30 days to 45 days, tighten credit terms or offer early-payment discounts. If a slow season is pushing your projected cash balance toward your minimum threshold, ask suppliers for net 45 or net 60 terms so payments line up better with the next revenue peak.
If cash is getting tight before a slow quarter, act before the pressure gets worse. You might delay planned hires, pause backfills, or shift bonus timing until after the next peak or trough. Cut low-ROI discretionary spend first, such as non-essential travel and duplicate software. After each change, update both forecast models so next month’s review uses the new assumptions.
The review turns seasonality from a surprise into a managed cycle. The four steps - pattern analysis, expense timing, forecasting, and monthly review - work as one system. Each part feeds the next. Historical patterns shape your expense calendar. Your expense calendar fills the forecast. The monthly review keeps each assumption current.
Research from the JPMorgan Chase Institute found that the median U.S. small business holds about 27 days of cash buffer - less than one month of outflows.[3][42]
For a seasonal business, that margin can disappear fast if a peak season underperforms or a slow period lasts longer than expected. Founders who build this process before they need it can pull forward a credit draw, delay a purchase order, or adjust hiring plans while there’s still time to move.
Phoenix Strategy Group helps growth-stage companies build forecasting cadences that connect near-term cash visibility with seasonal planning.
Aim to improve from an initial 10% to 20% variance to 5% to 10% over time.
Use a rolling 13-week forecast and update it weekly so you can spot timing shifts early. If actuals differ from projections by more than 5% of weekly cash movement, run a variance analysis, document the cause, and adjust future assumptions.
You can still build an effective cash flow forecast with the data you already have, like the last 6–12 months of sales history.
Start by cleaning up the numbers. Take out anomalies such as one-time bulk orders or short-term promo spikes. Then group the data into steady weekly or monthly periods so you’re working from a clear baseline instead of a noisy one.
After that, keep a 13-week rolling forecast in place. This lets you update projections with current data as it comes in, so your forecast gets closer to the mark over time as your records build up.
Update them often so they match current performance, not old expectations. Review your 13-week forecast every week and your 12-month forecast every month.
You should also revisit assumptions during month-end variance analysis. Then update them right away after major business events or any time a line item misses the forecast by more than your set threshold.