Published on
August 24, 2026


Most cash problems start before the bank account looks bad. If I run a company with $500,000 to $10 million in revenue, I need a simple system that tells me, today, whether cash will cover payroll, taxes, rent, debt, and vendors over the next 13 weeks.
Here’s the short version:
A few numbers show why this matters. Many small firms hold only about 27 days of cash buffer. And cash flow issues are tied to about 82% of small business failures. That means even a short delay in collections can create a payroll problem fast.
In plain English: profit does not pay bills on its own. Timing does. If I invoice $150,000, collect $90,000, and pay $130,000, I am down $40,000 in cash even if sales look fine.
This guide lays out the minimum system I’d use to spot trouble early, cut surprises, and make better spending and hiring calls.
Build this system around three inputs: clean data, a rolling forecast, and clear ownership. The point is simple: spot collection slowdowns and spending jumps before they create trouble for payroll, taxes, or debt service.
Start by mapping where cash comes in and where it goes out.
Track inflows from customer payments, direct deposits, and funding draws. Track outflows across payroll, rent, vendor invoices, taxes, debt service, and corporate card spend. Each cash flow should tie to one source system, such as your bank, accounting software, payroll system, payment processor, or card platform. Pull that data through secure, read-only integrations.
One detail matters more than it may seem: separate operating cash from restricted cash. If you lump them together, runway and available liquidity can look better than they are. Customer deposits, lender reserves, and earmarked funds aren't deployable, so they shouldn't sit in the same bucket as your operating balance.[2][3][6]
Use a daily cash position as your starting point. That means the cash balance across connected accounts, updated each morning.
From there, build a rolling 13-week forecast with:
For the next 6 weeks, use bottom-up inputs based on actual AR aging, scheduled AP, and confirmed payroll dates. For weeks 7 to 13, use top-down estimates linked to your revenue plan, but still show them in cash terms.[1][2][7]
The forecast shouldn't only reflect an average-case view. Use it to test bad timing too. Set up three scenario views - base, downside, and growth - so you can see the lowest projected cash point across the quarter. That's the number that should shape calls on hiring, collections tightening, and when to spend.[4][5][10]
Ownership needs to be clear. Accounting maintains actuals. Finance owns forecast assumptions and scenario analysis. The founder uses the output to make spending and hiring calls.[2][8][9]
The weekly review is just as important as the forecast itself. Every Monday, compare actual cash with last week's forecast, dig into variances above a set threshold, roll the window forward by one week, and confirm upcoming obligations. Then use a daily balance check to catch exceptions between reviews.
Next comes the part that turns this from a tracking process into an early-warning system: the metrics and alert thresholds.
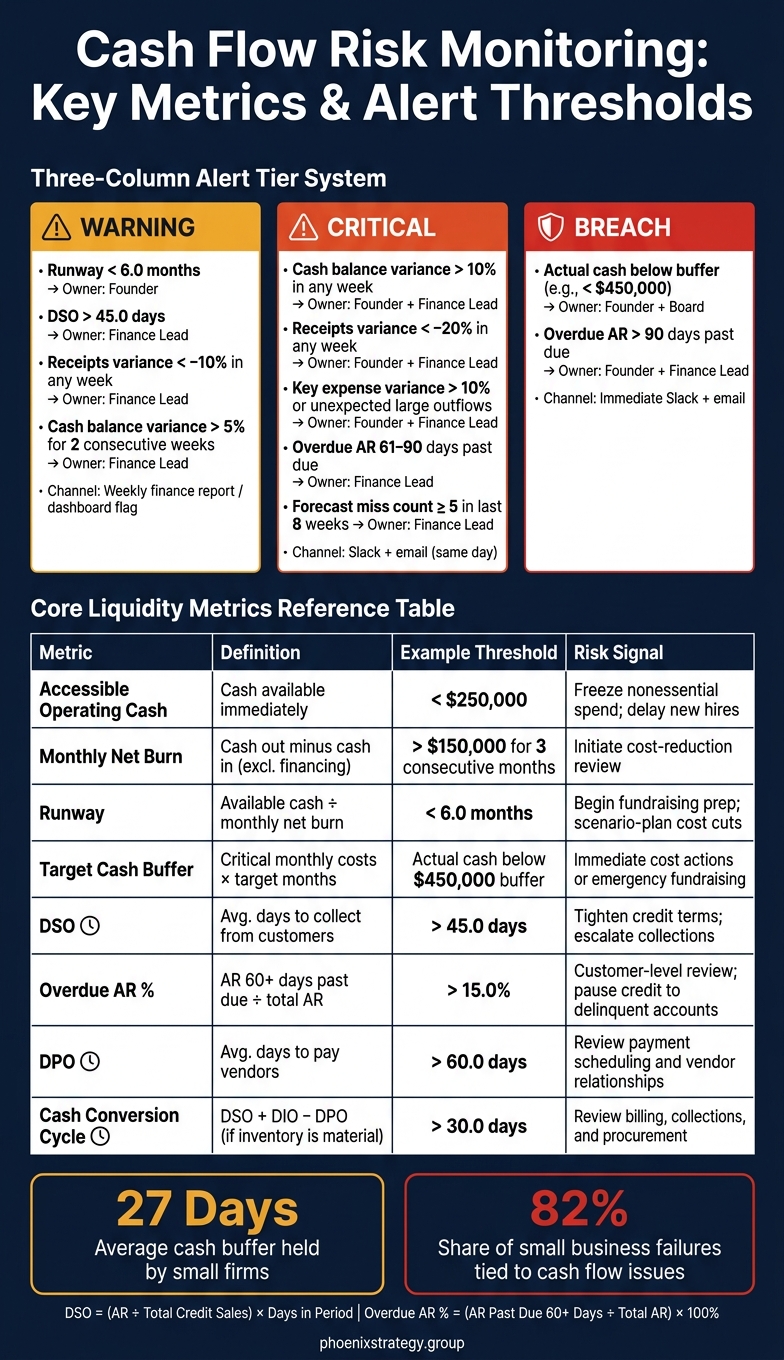
Cash Flow Risk Metrics: Warning, Critical & Breach Alert Thresholds for Founders
Track a small group of metrics that tie straight to cash decisions. Then set the few thresholds that should trigger action.
Start with these eight metrics. Each one has a plain definition, an example threshold, and a clear risk signal. Use them as your starting point, then adjust them to fit your business. Review them weekly, and check cash daily.
| Metric | Definition | Example Threshold | Risk Signal |
|---|---|---|---|
| Accessible operating cash | Cash you can use immediately | < $250,000.00 | Freeze nonessential spend; delay new hires |
| Monthly net burn | Cash out minus cash in, excluding financing | > $150,000.00 for 3 consecutive months | Initiate cost-reduction review |
| Runway (months) | Accessible operating cash ÷ monthly net burn | < 6.0 months | Begin fundraising prep; scenario-plan cost cuts |
| Target cash buffer | Critical monthly costs × target months | Actual cash below $450,000.00 buffer | Immediate cost actions or emergency fundraising |
| DSO | Average days to collect from customers | > 45.0 days | Tighten credit terms; escalate collections |
| Overdue AR % | AR past due 60+ days as a share of total AR | > 15.0% | Customer-level review; pause new credit to delinquent accounts |
| DPO | Average days you take to pay vendors | > 60.0 days | Review payment scheduling and vendor relationships |
| Cash Conversion Cycle (use only if inventory is material) | DSO + Days Inventory Outstanding – DPO | > 30.0 days | Review billing, collections, and procurement |
Formula note: DSO = (AR ÷ Total Credit Sales) × Days in Period. Overdue AR % = (AR Past Due 60+ Days ÷ Total AR) × 100%. Apply the same structure to DPO and CCC.
DSO is a leading indicator. When it moves up, collections are slowing and your forecast becomes less dependable. Overdue AR % tells you whether the issue sits with a few accounts or runs across the book. For overdue receivables, 31–60 days past due points to moderate delays, 61–90 days calls for immediate action, and more than 90 days usually means collections or write-off territory.[14]
These metrics tell you whether the 13-week forecast from the prior section still deserves your trust.
Track three variance measures each week:
Use the same formula for all three: (Actual − Forecast) ÷ Forecast × 100.0%.[11][13]
Set clear lines in the sand. A cash balance variance above 5.0% for two straight weeks is a warning. A miss above 10.0% in any week is critical. Any key expense line that misses by more than 5.0% is also a warning.[11][13]
A receipts shortfall of −20.0% in a single week is a hard signal. If you expected $300,000.00 and collected only $240,000.00, tighten collections right away and recalculate runway.[11][13]
Customer concentration adds a different kind of weakness. Calculate what share of your next 30 days of expected receipts comes from your top customers. If too much near-term cash depends on one customer, a single late payment can hit your weekly cash position hard, even when total AR looks fine on paper.[12][15]
Once the metrics are in place, assign each one a threshold and a response path. Use three alert levels. The table below links each alert to a metric, threshold, channel, and owner.
| Alert Level | Metric | Example Threshold | Alert Channel | Response Owner |
|---|---|---|---|---|
| Warning | Runway | < 6.0 months | Weekly finance report | Founder |
| Warning | DSO | > 45.0 days | Finance dashboard flag | Finance lead |
| Warning | Receipts variance | < −10.0% in any week | Automated email | Finance lead |
| Warning | Total cash balance variance | Absolute variance > 5.0% for 2 consecutive weeks | Weekly finance report | Finance lead |
| Critical | Total cash balance variance | Absolute variance > 10.0% in any week | Slack + email | Founder + Finance lead |
| Critical | Receipts variance | < −20.0% in any week or multiple weeks in a 30-day window | Slack + email | Founder + Finance lead |
| Critical | Key expense variance | Absolute variance > 10.0% or unexpected large outflows | Slack + email | Founder + Finance lead |
| Critical | Overdue AR aging | 61–90 days past due | Finance dashboard + email | Finance lead |
| Critical | Forecast miss count | ≥ 5 misses in the last 8 weeks | Weekly finance report | Finance lead |
| Breach | Target cash buffer | Actual cash below the buffer (e.g., < $450,000.00) | Immediate Slack + email | Founder + Board |
| Breach | Overdue AR aging | More than 90 days past due | Immediate email | Founder + Finance lead |
Too many alerts kill action. Keep warning alerts inside the weekly review. Send warning alerts only to reports, and route critical and breach alerts through same-day channels. Every alert should have a named owner and a predefined first step.
Use these thresholds to shape the dashboard views that follow. Those thresholds should roll up into the founder, finance, and board dashboards in the next section.
Once your alert thresholds are in place, put them in role-based dashboards. Each dashboard should answer three simple questions:
If a dashboard can't answer all three for its audience, it's probably doing too much. Keep each view tied to one audience, one job, and a small set of decisions.
The founder dashboard should fit on one screen and break into three bands: now, 13-week outlook, and action today.
The top band should show three large number tiles: Total Cash, Available Cash, and Restricted Cash. Restricted cash covers funds tied to covenants, escrows, or minimum balance rules. Under those tiles, add a short subtitle showing how many days of average burn the available cash can cover. That gives an instant read on current cash.
The middle band should hold a simple line or area chart with projected weekly cash balance over the next 13 weeks. Add a flat runway threshold line at the board-approved minimum cash floor. If projected cash drops below that line in any week, that week should stand out right away. That's the forward view.
The bottom band should list the top three to five cash-critical events for the current week. Think of it as the stuff that can’t slip:
Each item should show the amount in USD, the due date in MM/DD/YYYY format, the responsible owner, and a status tag.
Use green when runway is healthy and forecast variance stays within tolerance. Use amber when cash is moving toward the floor. Use red for a runway, covenant, or obligation breach. If a breach happens, show a red banner with a plain-language shortfall summary.
When the founder dashboard shows risk, the finance dashboard should make it easy to trace that risk to the exact invoice, payment, or forecast line behind it.
The finance dashboard is a diagnostic tool, not a summary screen. Its job is to help the team move from a warning to the exact invoice or payment behind it in minutes, not hours.
Start with AR aging at the top. Show summary tiles for total AR in these buckets: current, 1–30 days, 31–60 days, 61–90 days, and 90+ days past due. Next to that, add a bar chart showing customer concentration among the top five accounts as a percentage of total AR. Clicking a bucket should open an invoice-level list filtered by customer, amount, and due date.
Follow the same setup for AP aging, with one extra layer: a tag that marks each item as must-pay or deferrable.
Below aging, add a weekly forecast variance table. It should show forecasted versus actual cash inflows and outflows for each of the past 13 weeks, plus variance in both dollars and percentage. Keep the color coding tied to the alert thresholds you've already set. Clicking into a week should show which categories drove the variance, such as collections, payroll, or taxes. Clicking a category should then show the underlying transactions.
The last panel should be a rolling 13-week obligations calendar. Include payroll dates and amounts, federal and state tax due dates, debt service payments, rent, and large vendor payments. Any obligation above the team’s review threshold should be flagged for review. The drill-down should show the underlying contract or agreement and the contact responsible for resolution.[16][20]
The board doesn't need operating detail. It needs trend, trajectory, and decision points.
A dedicated cash slide in the board packet should include ending cash for the period, a monthly net burn trend over the last 6–12 months, runway in months, and a cash bridge waterfall showing how cash moved over the period: starting cash, operating cash flow, financing cash flow, and ending cash.[17][19]
Next to the base case, show the impact of a downside scenario on runway.[16][18][19] If runway falls below the board’s target threshold, add a Decision Required section that states the options and the response timeline in plain terms.
The table below shows which KPIs belong in each dashboard, so each audience gets the right level of detail.
| KPI | Founder Quick-View | Finance Deep-Dive | Board Snapshot |
|---|---|---|---|
| Total cash & available cash | ✓ | ✓ | ✓ |
| Runway (months) | ✓ | ✓ | ✓ |
| Burn rate / trend | ✓ | ✓ | ✓ |
| 13-week cash forecast chart | ✓ | ✓ | - |
| Cash bridge (waterfall) | - | - | ✓ |
| Downside scenario & runway impact | - | - | ✓ |
| AR/AP aging buckets | - | ✓ | - |
| Customer concentration (% of AR) | - | ✓ | - |
| Weekly forecast variance | - | ✓ | - |
| Upcoming obligations calendar | - | ✓ | - |
| Top 3 risks this week | ✓ | - | - |
| Decision required (runway < target) | - | - | ✓ |
Once the dashboard framework is set, the next step is to move those same rules out of spreadsheets and into live data feeds. AFP's 2025 FP&A Benchmarking Survey reports that 96% of FP&A professionals still use spreadsheets for planning, and 82% of finance professionals are making decisions on outdated data.[21][22] For a growth-stage founder, that makes even basic cash questions harder to answer with confidence right when the pressure is on.
Start with a system the team can use, then tighten it up over time.
Weeks 1–2: Set one cash source of truth, assign owners for bank, accounting, payroll, and billing data, and lock in the thresholds the team will use.
Weeks 3–4: Connect bank, accounting, payroll, and billing feeds. Then build a weekly 13-week forecast with opening cash, inflows, outflows, and ending balance.
Month 2: Publish the daily cash position by 9:00 AM each business day and refresh the 13-week forecast after weekly reconciliation.
Month 3: Add alert logic, variance tracking, and board-ready views, backed by three months of reconciled data.
Speed matters, but clean inputs matter more. The problem usually isn't the tool. It's poor data hygiene. Three common failure modes stop live cash visibility, and each one has a direct fix:
A minimum viable cash monitoring system has six parts working together: one source of cash truth, a weekly rolling 13-week forecast, a small set of liquidity and working capital metrics, tiered alerts tied to real thresholds, role-specific dashboards for founders, finance, and the board, and a steady review cadence. None of these parts does much on its own. Together, they form a system.
The single cash truth keeps every conversation tied to the same reconciled numbers. The 13-week forecast gives enough forward view to act before a cash gap turns into a crisis; a well-kept rolling forecast can surface looming shortfalls 8 weeks in advance.[23] The metrics turn messy financial data into clear signals. The alerts push those signals into action. The dashboards make sure each audience sees what matters to them. And the weekly review cadence turns the whole thing into a habit instead of a one-off project. That's how founders build a repeatable cash system, not just another report.
Phoenix Strategy Group helps growth-stage companies build this system through bookkeeping, fractional CFO, FP&A, data engineering, and M&A support. The result is faster decisions, cleaner reporting, and clearer cash visibility.
Usable cash is the cash you can actually use day to day. It does not include money set aside for a specific purpose or funds you can't use for normal operations.
To calculate it, add the ending balances in your operating, savings, and money market accounts. Then subtract restricted cash. What’s left is your baseline for tracking liquidity targets like your minimum reserve or cash runway.
Check and reconcile your bank balances every week so the number stays current and accurate.
It needs to be accurate enough to spot timing-driven liquidity shortfalls before they turn into a problem. Update it every week, then check how close it was by comparing forecasted ending cash with the actual bank balance.
Track weekly forecast vs. actual ending cash, and work to tighten the variance over time - from about 10%–20% down to 5%–10%. To keep the review focused, set a materiality threshold such as $10,000 or 5% of weekly cash movement, so you’re looking at misses that matter.
Use your green, yellow, and red status indicators to decide when to escalate.