Published on
August 13, 2026


A company can post solid revenue, gross margin, and EBITDA - and still lose money on parts of its sales mix. In M&A diligence, I use contribution margin to see which products, customers, channels, and business lines add profit after variable costs like freight, rebates, returns, commissions, and account support.
Here’s the short version:
A few numbers make the point fast. Reports cited in the article show that 15%–40% of active SKUs are often unprofitable, and one bank review found 47% of customers were unprofitable once the right costs were assigned. That is why contribution margin matters in a deal.
| Area | What I check | Why it matters in diligence |
|---|---|---|
| Products/SKUs | CM dollars, CM%, returns, inventory drag | Finds low-margin or loss-making items |
| Customers | Cost-to-serve, rebates, freight, support load | Shows which accounts add profit and which drain it |
| Channels | CM%, commissions, discounting, CAC payback | Tests whether growth is worth the spend |
| Business lines | Standalone CM vs. pro forma CM | Helps shape valuation and post-close plans |
| Financial tie-out | Bridge from GAAP gross margin to CM1/CM2 | Makes the analysis usable and testable |
If I’m reviewing a deal, this is the filter I want early: what revenue adds contribution, what revenue destroys it, and what changes under new ownership.
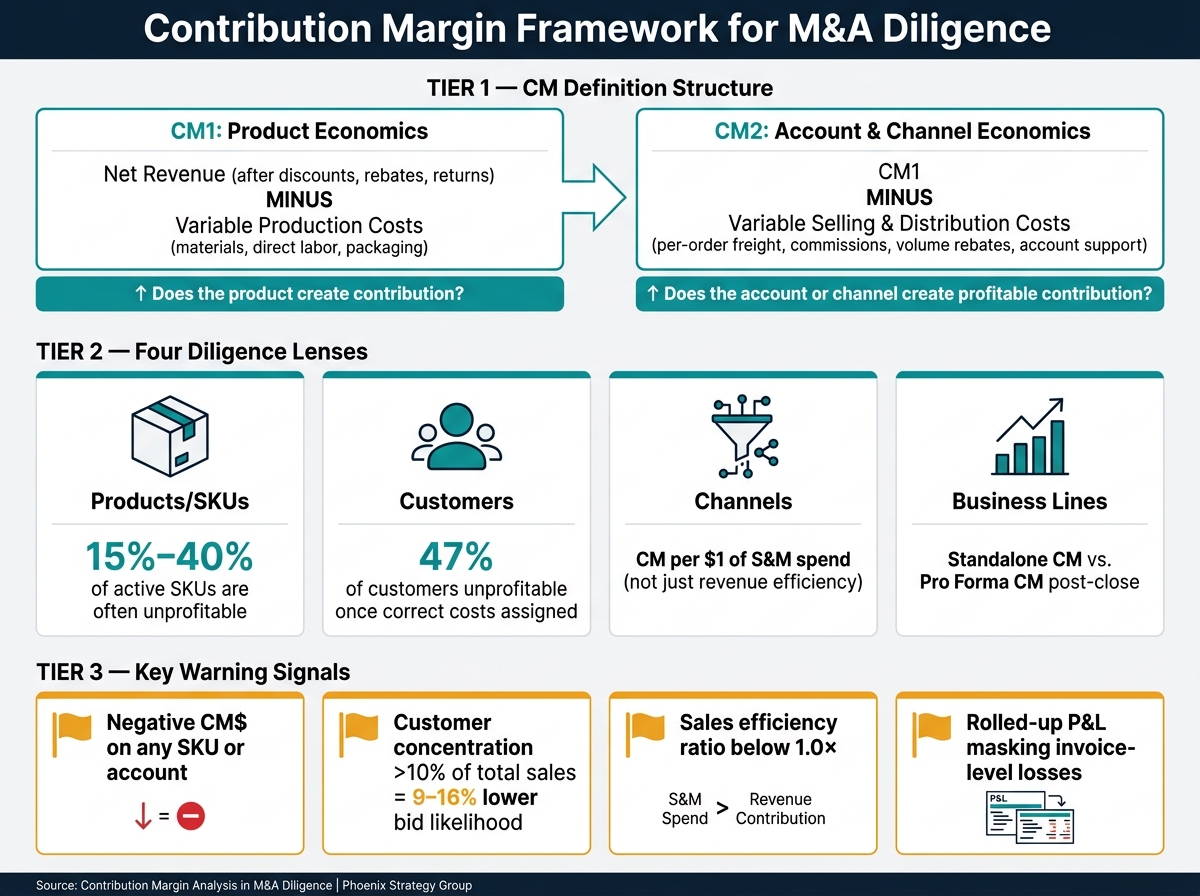
Contribution Margin Framework for M&A Diligence: CM1 vs CM2 by Product, Customer & Channel
Set one contribution margin definition before the work starts. If that doesn’t happen, buyers and sellers end up looking at numbers built on different rules. That’s how deal friction shows up at the worst time. Every SKU, account, and channel test that comes next needs to run on the same CM logic.
Use a two-tier CM structure.
This split helps answer two separate questions: Does the product create contribution? And does the account or channel create profitable contribution?
Use invoice- and order-level data, not summary P&L data. In practice, that means records tied to each invoice or order with SKU, customer ID, date, quantity, and price, plus matching cost records for freight, commissions, and rebates. That level of detail matters. In food packaging, a customer profitability study found that the top 20.41% of customers contributed 58.39% of total contribution margin, while 4.08% of customers caused a 0.13% loss.[4] You don’t spot that from rolled-up reporting. You spot it when costs can be tied back to each account.
Each cost classification call should go into a short CM methodology document. That includes what counts as variable, how shared freight is allocated, and how non-recurring promotions are treated. Think of it as the rulebook for the model. Write it once, then apply it the same way across products, customers, and channels. It also gives the buy-side team a clean way to pressure-test assumptions without tearing the whole model apart.
With that framework in place, the next move is to test which products and customers are pulling their weight.
After CM tiers are set, tie them back to GAAP so the model can be checked and trusted. Contribution margin is usually treated as a non-GAAP management measure, so any outside presentation should show a clear reconciliation to the GAAP anchor, usually gross margin, with each adjustment labeled and quantified.[2][3]
Start with GAAP revenue and COGS from the income statement. Then map each CM input, such as rebates, returns, freight, and commissions, to the related GAAP account. The goal is simple: no double-counting, no gaps. From there, build a bridging schedule that shows the step-by-step move from GAAP gross margin to CM1 and CM2.
Repeat that bridge for each period. Also check that aggregated transaction-level totals match GAAP totals for revenue and COGS. If the totals don’t tie, the unit economics won’t hold up under review. When they do tie, both sides can compare product, customer, and channel performance on the same basis.
Use TTM as the base period, with monthly or quarterly cuts to show seasonality and trend. That bridge then becomes the starting point for product, customer, and channel analysis.
Once your CM framework ties back to the financials, you can use that same lens across SKUs and customer accounts. The point is simple: find out which products and customers add contribution dollars and which ones quietly eat them up.
Start by ranking each product line by CM dollars and then by CM%. Revenue alone can fool you. A product line doing $10 million in revenue at 8% CM% adds less contribution than a $4 million line at 65% CM%. That’s why, in many portfolios, a fairly small slice of SKUs produces most of the contribution.
Watch for laggards: low CM%, negative CM dollars, high returns, or a service load that’s too heavy for the revenue it brings in. These SKUs soak up working capital without earning their keep. In some cases, a company may find that 15% of SKUs generate only 3% of CM dollars but 25% of inventory dollars. That’s a plain case for rationalization.[5][6][7]
| Product Line | Revenue (TTM, USD) | CM Dollars (TTM, USD) | CM% | YoY Growth Rate | Risk Flags |
|---|---|---|---|---|---|
| Core Hardware | $18,500,000 | $7,025,000 | 38.0% | +12.5% | Moderate returns, diversified base |
| Premium Services | $9,750,000 | $6,830,000 | 70.1% | +28.4% | High CM, low concentration |
| Legacy Accessories | $4,100,000 | $410,000 | 10.0% | -8.2% | High returns, declining volume |
| Custom Projects | $3,500,000 | -$175,000 | -5.0% | +5.0% | Single key customer, over-discounted |
Premium Services throws off almost as many CM dollars as Core Hardware on about half the revenue. That should make you stop and look twice. Custom Projects, on the other hand, looks like growth if you only glance at top-line numbers. But once you check contribution, the picture changes fast: negative CM, heavy discounting, and one customer doing most of the buying. That kind of finding can change valuation, deal structure, or cleanup plans.
The same logic works at the account level. It helps you see whether the issue sits in product mix, customer mix, or both.
Run the same CM test for customer accounts. Revenue rank and profit rank almost never line up neatly. A $3 million customer with light service needs may add more contribution than a $5 million customer that needs heavy support, custom work, and expensive freight.
At the account level, CM means net revenue minus direct cost-to-serve, including:
Then group accounts into cohorts, such as enterprise vs. mid-market or direct vs. channel. That makes it easier to spot which segments produce profitable, durable relationships and which ones create volume without much payoff.
| Customer Cohort | Revenue (TTM, USD) | CM Dollars (TTM, USD) | CM% | Contract Term | Retention Risk | Concentration Indicator |
|---|---|---|---|---|---|---|
| Enterprise – Direct | $22,000,000 | $9,680,000 | 44.0% | 3-year, auto-renew | Low (98% logo retention) | Top 3 customers = 55% of cohort |
| Mid-Market – Direct | $14,500,000 | $9,135,000 | 63.0% | 1-year, standard | Moderate (90% retention) | Highly diversified |
| SMB – Channel | $8,750,000 | $5,075,000 | 58.0% | 1-year, reseller-based | Higher (82% retention) | Top reseller = 40% of cohort |
| Custom Enterprise Deals | $5,250,000 | $630,000 | 12.0% | 1–2 year, bespoke | High (deal by deal) | Single flagship deal = 60% |
The Mid-Market – Direct cohort posts the strongest CM% and has diversified exposure. That’s the kind of customer base buyers usually want more of. Custom Enterprise Deals looks big on revenue, but after cost-to-serve, it adds very little. On top of that, it’s heavily concentrated.
That concentration risk isn’t just a gut feeling. Academic research found that firms with at least one customer above 10% of total sales had a 9% lower likelihood of receiving a bid, and targets in the top decile of customer concentration had a 16% lower likelihood than those in the bottom decile.[8] Buyers price that risk in.
Put CM and concentration together. A large customer with strong CM and a multi-year contract is a very different situation from a large customer with weak CM on a short-term bespoke deal. That gives buyers and sellers a better read on cash durability, not just revenue size.
After product and customer CM, the next step is simple: check whether sales spend is buying profitable growth.
Revenue growth tells you how much volume is coming in. Contribution margin tells you what that growth is worth. In diligence, that distinction matters. The real question isn't whether sales and marketing spend brings in revenue. It's whether that spend creates incremental contribution.
A common way to test this is sales efficiency: new revenue, or new ARR in SaaS, divided by sales and marketing spend. If the ratio falls below 1.0×, the business is spending more on sales and marketing than it is bringing in through new revenue.[9][10][11]
But that ratio, by itself, can give a false sense of comfort. A channel might look fine on revenue efficiency and still produce weak CM% because discounts, commissions, or setup costs eat away at the economics. That's why buyers look at the efficiency ratio alongside CM per dollar of spend.
| Channel | New Revenue (TTM, USD) | CM Dollars (TTM, USD) | CM% | S&M Spend (TTM, USD) | Sales Efficiency Ratio | CM per $1 of S&M Spend |
|---|---|---|---|---|---|---|
| Direct Enterprise (Field) | $9,200,000 | $4,048,000 | 44.0% | $3,100,000 | 2.97× | $1.31 |
| Inside Sales (Mid-Market) | $6,800,000 | $4,284,000 | 63.0% | $1,950,000 | 3.49× | $2.20 |
| Paid Digital Acquisition | $4,100,000 | $820,000 | 20.0% | $2,800,000 | 1.46× | $0.29 |
| Channel / Reseller | $3,500,000 | $1,925,000 | 55.0% | $680,000 | 5.15× | $2.83 |
The split here is hard to miss. Inside Sales and Channel / Reseller produce the most CM for each dollar spent. Paid Digital Acquisition, by contrast, generates only $0.29 in CM per $1 of spend after ad costs and discounts squeeze margin.
That same channel-level view also helps buyers test how long it takes to earn back customer acquisition cost. The usual check is CAC payback, often calculated as CAC ÷ (monthly revenue per customer × contribution margin %).[15][16][17][18] Long payback periods can be a warning sign. On paper, growth may look solid. In practice, it may demand more cash than expected, especially in segments with higher churn or heavy implementation costs.[15][17][18]
Once the channel economics make sense, buyers usually turn that work into a post-close profit view by business line.
The goal is to build a pro forma CM view by business line and ask a practical question: what could each unit look like under new ownership? This is where buyers test specific changes they can defend, such as pricing discipline, procurement savings, sales force realignment, or overhead consolidation. The model compares current CM with pro forma CM after those defined changes. Each case is modeled on its own so benefits don't get counted twice.[12][13][14]
| Business Line | Standalone Revenue (USD) | Standalone CM$ (USD) | Standalone CM% | Synergy Assumption | Pro Forma CM$ (USD) | Pro Forma CM% |
|---|---|---|---|---|---|---|
| Core Hardware | $18,500,000 | $7,025,000 | 38.0% | 4% price increase, 2% COGS reduction via procurement | $9,065,000 | 49.0% |
| Premium Services | $9,750,000 | $6,830,000 | 70.1% | Cross-sell to acquirer's installed base (+$1.2M revenue) | $7,670,000 | 67.0% |
| Legacy Accessories | $4,100,000 | $410,000 | 10.0% | SKU rationalization, exit lowest-margin lines | $540,000 | 22.5% |
| Custom Projects | $3,500,000 | ($175,000) | (5.0%) | Reprice or exit; reallocate sales coverage | $0 – $280,000 | 0–8.0% |
A few lines stand out right away.
This is where CM stops being just a reporting metric. It becomes a decision tool. It shows buyers where to put more money, where to restructure, and where to walk away. Clean, segmented CM data before diligence makes those post-close calls much easier.
After you test product mix, customer quality, sales efficiency, and business-line profit, one question still sits at the center of the deal: do the numbers actually hold up?
EBITDA can gloss over margin leakage at the SKU, account, and channel level. Contribution margin gives a cleaner view of which revenue is still profitable after close.[1][19] When you break CM out by segment, product, customer, and channel data become a practical filter for pricing, valuation, and integration calls.
That leads to two clear actions:
Phoenix Strategy Group helps growth-stage companies build diligence-ready CM reporting through bookkeeping, fractional CFO, FP&A, data engineering, and M&A support. Making CM part of M&A readiness can strengthen negotiating leverage and cut down on late-stage surprises.
CM1 is revenue minus direct production or service costs, also called COGS. These are the costs directly tied to delivering the product or service.
CM2 builds on CM1 and then subtracts other variable costs, like logistics, fulfillment, and payment fees. Transaction- or deal-related items are usually handled through QoE adjustments, not included in CM1 or CM2.
Invoice-level data lets buyers dig into margins at a much deeper level.
Instead of relying on blended averages, they can tag invoice lines and direct costs to specific products or services and see what's actually making money. That makes it easier to test product mix, customer quality, and sales efficiency.
From there, buyers can spot which segments drive profit, which ones eat up time and resources, and whether the valuation is based on earnings that will hold up over time and day-to-day business performance.
Contribution margin can shift deal value because it puts the focus on profit after variable costs that move with each product line, customer group, or sales channel.
During M&A diligence, buyers look at segment contribution margin - revenue minus direct variable costs - to see which offerings are actually making money once those costs are stripped out. If that margin is weaker than management suggested, buyers may cut their view of sustainable earnings and future forecasts, which can lower valuation. If it’s stronger, it can support higher multiples or lead to better deal terms.



