Published on
September 21, 2026


If your company uses floating-rate debt, a rate jump can cut runway fast. In this guide, I’d boil the job down to six moves: list every debt facility, measure how much interest changes when rates move, set a target fixed-versus-floating mix, use hedges only where they fit, stress test runway and covenants, and report the results on a set schedule.
From March 2022 to July 2023, the Fed moved from near 0% to 5.25%–5.50%, and average commercial loan rates climbed from 4.76% to 8.19%. For a growth firm, that can mean higher monthly cash interest, less room under covenants, and a shorter cash timeline. A simple example from the article shows that on a $2,000,000 floating-rate loan, a 150 bps move can add about $30,000 a year in interest.
Here’s the short version of what I’d pay attention to:
A lot of firms treat rate risk like a side issue. I wouldn’t. It changes cash burn, debt service, and refinancing pressure at the same time. The article’s main point is simple: keep the model current, test rate shocks every quarter, and make rate exposure a standing finance decision, not a one-off project.
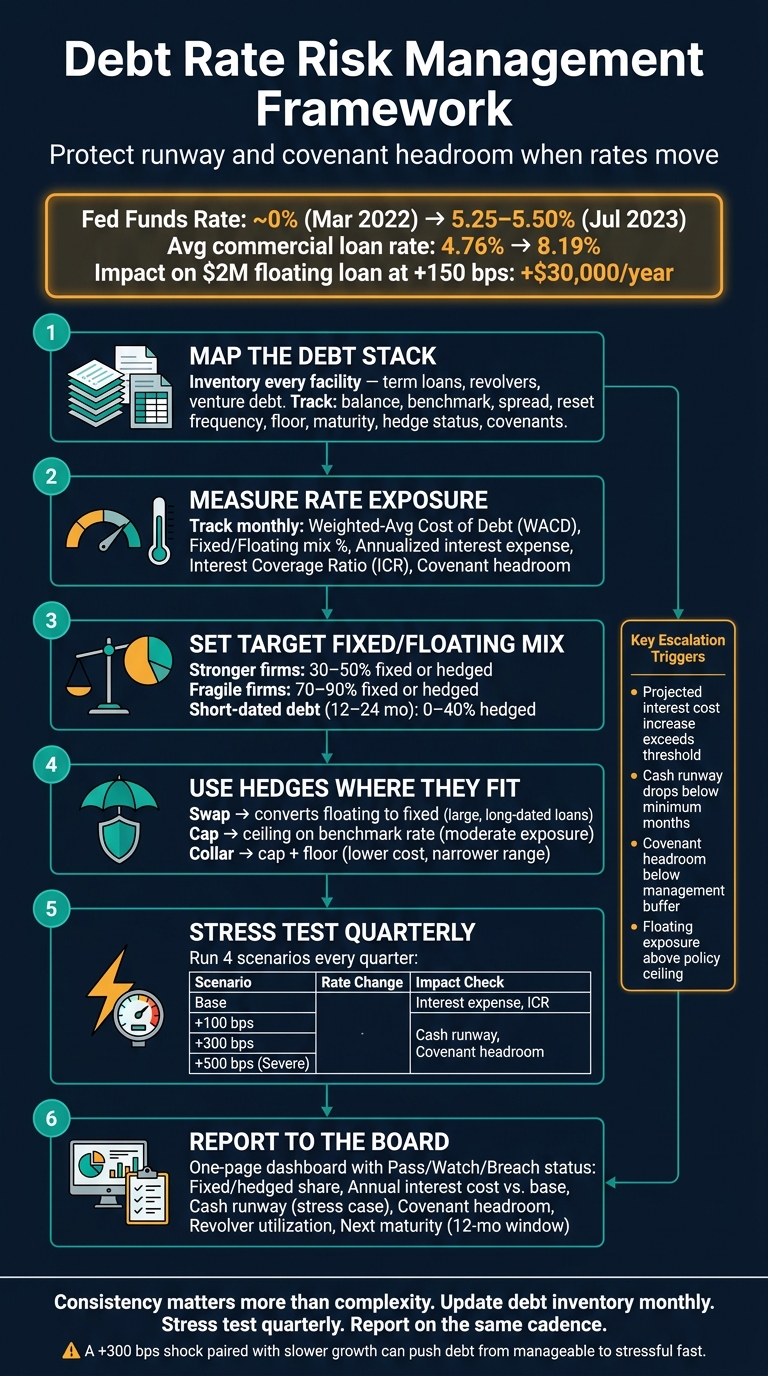
Debt Rate Risk Management Framework for Growth Firms
Start with one debt inventory. Give each facility its own row and use the same fields across the board: balance, benchmark, spread, reset frequency, floor, maturity, amortization, planned draws, hedge status, and covenants. Keep it simple, but make it complete.
Then rank facilities by incremental interest expense, not just by principal size. That matters because the biggest balance isn't always the one that hits cash flow the hardest when rates move. This inventory becomes the base for the stress tests and board reporting that come next.
Not all debt behaves the same way. Reset timing, draw patterns, and covenant triggers can change runway risk in a big way. So instead of grouping everything together, compare facilities side by side and rank them by the added interest cost under rate shocks.
Apply +100 bps and +300 bps to each floating-rate instrument's benchmark. Keep spreads constant. Then calculate the added annual interest expense for each facility.
| Feature | Bank Term Loan | Revolver | Venture Debt |
|---|---|---|---|
| Repricing frequency | Monthly or quarterly | Daily or monthly | Monthly or quarterly; some fixed to maturity |
| Draw profile | Fully drawn at close or in tranches | On-demand, fluctuates with working capital | Milestone-based tranches, then term-style |
| +100 bps impact | Medium | Medium–High, depending on balance | High |
| +300 bps impact | High | High | Very High |
| Key risk triggers | Leverage, minimum EBITDA, DSCR | Borrowing base, liquidity, coverage tests | Minimum cash, ARR growth, milestone conditions |
Once the stack is mapped, focus on the few metrics that change decisions. These are the numbers that tell you whether to hedge, refinance, or hold onto cash.
Weighted-average cost of debt (WACD). Track WACD every month. Multiply each facility's all-in rate by its current outstanding balance, add up those amounts, and divide by total debt outstanding. If WACD keeps moving up while revenue or margin stays flat, that's a warning sign for runway and profitability.
Effectively fixed vs. floating mix. Classify each instrument as effectively fixed or floating, after adjusting for any swaps or caps already in place. Then show each as a share of total debt. A higher floating share means more exposure when rates jump.
Annualized interest expense. Show annualized interest expense at today's rates and under +100 bps and +300 bps shocks. This should plug straight into your runway model.
Interest coverage ratio (ICR). Track how much room you have before hitting each ICR threshold. Recalculate it under rate shock scenarios so you can see where pressure shows up first.
Covenant headroom. Show current headroom, then show how much disappears under +100 bps and +300 bps across minimum liquidity, DSCR, and leverage covenants.
Once you’ve mapped your exposure, the next step is turning that map into a target hedge mix. In plain English: decide how much of your debt should be effectively fixed versus floating. That target becomes the policy version of the metric you track each month.
The right mix depends on a few plain business facts: how steady revenue is, how much margin room you have, how much you depend on new capital, how long the debt runs, and how much cash-flow swing the business can handle.
Start by scoring five inputs: revenue predictability, margin resilience, reliance on new capital, debt duration, and cash-flow volatility tolerance. Then map that score to a policy range.
Stable, high-margin SaaS firms can usually live with more floating exposure. Lumpy, low-margin businesses usually need more protection. As a starting point, stronger firms often target 30%–50% fixed or hedged. More fragile firms often target 70%–90%.
Short-dated debt can change that math. A 12- to 24-month revolver or bridge facility can support a lower fixed or hedged share, often 0%–40%. The risk window is shorter, and the hedge may not earn back its cost.
Write these ranges down as policy. Set target ranges by debt type, spell out when temporary drift is allowed, and tie the ranges to clear triggers like ARR stability, burn rate, cash balance, and debt maturity profile. Review the policy at least once a year, or after any major financing event.
If your current mix is outside the target range, you can use hedges to move the mix without changing the loan itself.
Three main tools can shift your effective fixed-floating mix without renegotiating the loan underneath it.
A swap turns floating debt into synthetic fixed debt. It tends to fit larger, longer-dated term loans when rate certainty matters more than flexibility.
A cap sets a ceiling on the benchmark rate. You get downside protection, but you still keep the benefit if rates fall.
A collar pairs a bought cap with a sold floor. That lowers cost, but it also narrows the range of rate outcomes you can benefit from.
| Instrument | What It Does | Upfront Cash Cost | Mark-to-Market Exposure | Flexibility | Typical Use Case |
|---|---|---|---|---|---|
| Swap | Converts floating to fixed | Minimal, embedded in rate | High - bilateral and can require collateral | Low - costly to unwind | Large, long-dated term loans |
| Cap | Limits maximum benchmark rate | Upfront premium required | Limited to the premium paid | Medium | Moderate floating exposure; want upside if rates fall |
| Collar | Bands rate between a cap and floor | Lower than a standalone cap | Option-based; floor limits downside participation | Medium | Budget certainty at lower cost; willing to cap rate savings |
Among companies that hedge interest-rate exposure, 91% use swaps, with collars and caps used more selectively.[1][2] That said, swaps are not always a clean fit for growth firms. Mark-to-market risk and unwind costs can become a headache if the debt structure changes before the hedge ends.
This choice matters because loan structure and budget risk often pull in opposite directions.
Fixed debt gives you certainty, but you usually pay more for it. Floating debt often starts cheaper, but it leaves your budget and covenant results open to rate moves.
A 1 percentage point rate increase can lift the average corporate interest expense ratio by about 0.5 percentage point, with the impact peaking about five quarters later.[3] If your covenant headroom is already thin, that delay can sneak up on you.
Prepayment and refinancing terms matter too. Fixed-rate loans often come with make-whole provisions or step-down fees, which can make early repayment costly. Floating-rate facilities, especially revolvers, usually allow more flexible prepayment. That matters a lot when your capital structure is still moving.
| Dimension | Fixed Rate | Floating Rate |
|---|---|---|
| Expected all-in cost | Higher at origination; certain over term | Lower initially; uncertain over time |
| Downside protection | Strong - locked in regardless of rate moves | Low without hedging |
| Refinancing flexibility | Lower - prepayment penalties common | Higher - easier to prepay or restructure |
| Budgeting accuracy | High - expense is predictable in dollars | Medium to low - depends on future rates |
Use fixed debt, or hedged floating debt, when runway is tight, revenue is lumpy, or the next raise is uncertain. Use more floating exposure when cash flow is steady and the debt is short-dated.
Once you’ve set a target fixed-floating mix and picked a hedging approach, the next job is to make interest rate risk management repeatable. That usually comes down to three things: a stress-testing model, a short policy, and a board dashboard people will actually use.
Use the target fixed-floating mix from the prior section as the baseline for quarterly stress tests. Run quarterly scenarios for:
The point of each scenario is simple: check whether the target mix still works when rates jump, cash runway gets tighter, and covenants come under pressure.
Start with covenant and runway impact. Model how higher rates change cash runway, covenant headroom, interest coverage, annual interest expense, and total debt service. Add refinancing assumptions to maturities and covenant modeling too. Growth firms often rely on refinancing at maturity instead of full amortization, so the risk of facing higher rates in that window belongs inside the stress test, not buried in a note.
Keep the model focused on the inputs that drive decisions:
| Metric | Base Case | +100 bps | +300 bps | Severe (+500 bps) |
|---|---|---|---|---|
| Annual interest expense | Baseline | Higher | Much higher | Highest |
| Interest coverage ratio | Strong | Lower | Tighter | Tightest |
| Cash runway | Baseline | Shorter | Much shorter | Shortest |
| Covenant headroom | Comfortable | Reduced | Narrow | At risk |
| Total debt service | Stable | Higher | Much higher | Highest |
| Recommended action | Monitor | Review hedge | Adjust structure | Escalate or refinance |
Turn the target mix into a one-page policy with clear limits and escalation rules. It should spell out five things: who monitors exposure, how often it gets reviewed, which instruments are approved, the target mix by debt type, and the escalation triggers.
For escalation triggers, tie them to liquidity and budget impact, not just market-rate moves on their own. Good thresholds include:
Each trigger should also name the required response, whether that’s a finance review, management approval, or board notification. No gray area. No guessing about what happens next.
The board needs a one-page dashboard that shows where the company stands, whether it’s inside policy, and what needs action before the next meeting. In plain English, the dashboard should turn model output into choices the board can approve or defer.
A quarterly board dashboard should cover six metrics: fixed vs. floating mix, weighted-average rate, hedge coverage, policy-limit status, upcoming maturities in the next 12 months, and forecasted liquidity under the +300 bps scenario.
Use Pass / Watch / Breach across all metrics:
| Metric | Policy Focus |
|---|---|
| Fixed or hedged share of term debt | Meets the policy minimum |
| Annual interest cost increase vs. base | Stays within the approved threshold |
| Cash runway (stress case) | At or above the minimum buffer |
| Covenant headroom | At or above the management buffer |
| Revolver utilization | Below the policy ceiling |
| Next maturity | Visible in the next 12 months |
The dashboard should always end with an "Actions Needed" row. That row should convert status signals into direct decisions: execute a cap, reduce planned draws, begin refinancing conversations, or bring a hedge proposal to the next board meeting. That’s how the dashboard helps the board decide whether to hedge, refinance, or keep the current structure.
Growth firms without in-house treasury often rely on a fractional CFO to keep the model, policy, and board dashboard up to date.
The model, policy, and board dashboard matter only if they shape monthly decisions. Debt rate risk is about protecting runway and covenant headroom when rates move the wrong way. The companies with the most exposure are often smaller, highly leveraged firms with short maturities and a large floating-rate mix - the same setup many growth-stage businesses have.[5][6][8]
To make that framework repeatable, you need a fixed cadence. The playbook is simple:
That last point does a lot of the heavy lifting. Consistency matters more than complexity.
A +300 basis point shock, paired with slower growth, can push debt from manageable to stressful fast. It can create covenant pressure or force an earlier refinancing than expected.[4][7]
For lean finance teams, the hard part is usually keeping the model current month after month. Growth firms without in-house finance support may need outside help to keep the debt model, policy, and board dashboard up to date. Phoenix Strategy Group supports that work through fractional CFO, FP&A, bookkeeping, data engineering, and M&A support.
Rate risk management works only when the debt model, policy, and board dashboard stay current. Update the debt inventory monthly, run stress tests quarterly, and refresh the board dashboard on that same cadence.
You may have too much floating-rate debt if rates like SOFR or Prime push your borrowing cost to 10% to 15% or more. At that point, debt can start squeezing cash flow and burn in a very real way.
A simple way to pressure-test this is with a rolling 13-week cash flow forecast. Keep DSCR above 1.25x, watch total debt at about 0.5x to 1.0x ARR, and treat it as a warning sign if covenant headroom drops below 0.10x or a breach is less than two quarters away.
Growth firms should look at these tools when variable-rate debt starts putting pressure on cash flow stability or covenant compliance, especially when rate moves are hard to call.
A swap converts a variable rate into a fixed rate, which makes interest costs more predictable. A cap puts a ceiling on the rate while still letting you benefit if rates drop. A collar sets a band for interest costs, giving you a floor and a ceiling.
Run a few scenarios - base, optimistic, and pessimistic - to see how changes in SOFR or Prime affect liquidity and covenant compliance. Since venture debt usually comes with variable rates, you need to stress-test cash flow for higher borrowing costs.
Build a 12–24 month cash flow forecast that maps out principal, interest, and covenant tests against revenue timing and cash reserves. If the downside case leads to a covenant breach or a cash shortfall, it’s a clear sign to revisit the debt structure.



