Published on
July 21, 2026

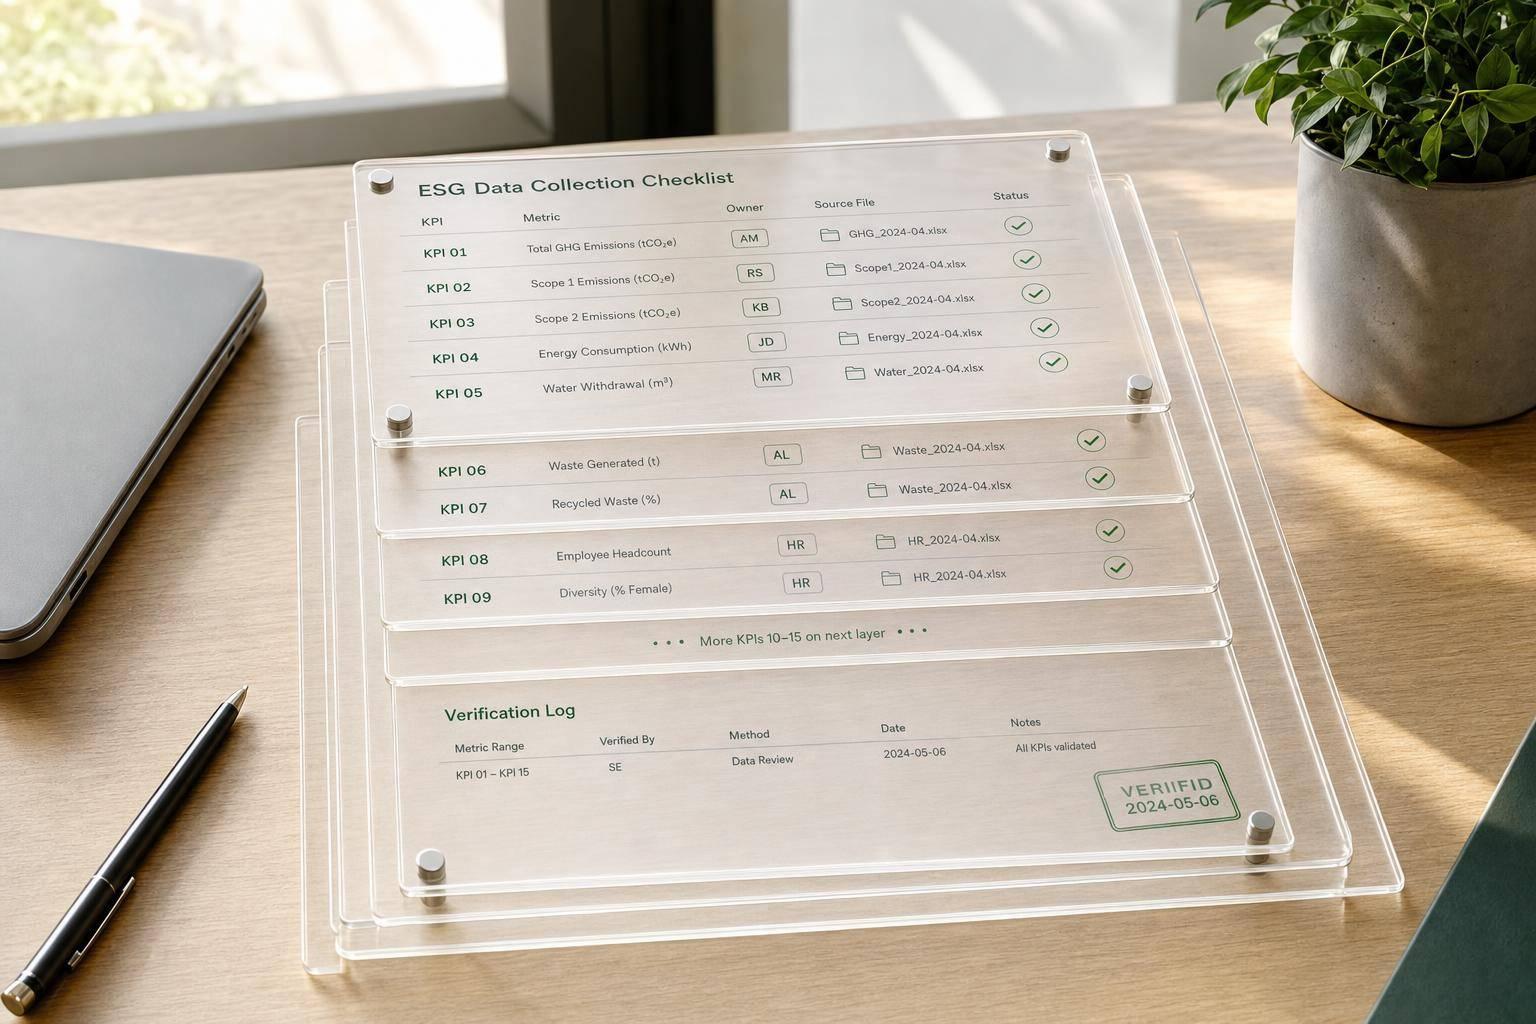
If your company makes $500,000 to $10 million a year, ESG data should run like part of your close process - not like a side project.
I’d boil the article down to this: pick 10–20 metrics, give each one a single owner, tie every number to one source file, review it on a set schedule, and keep proof before you share anything with lenders, investors, or buyers. That’s the core idea.
Here’s the short version of what matters most:
In plain English: the problem usually isn’t missing data. It’s inconsistent definitions, unclear ownership, and weak file control. If you fix those three things, ESG reporting gets much easier to run and explain.
A few points stand out:
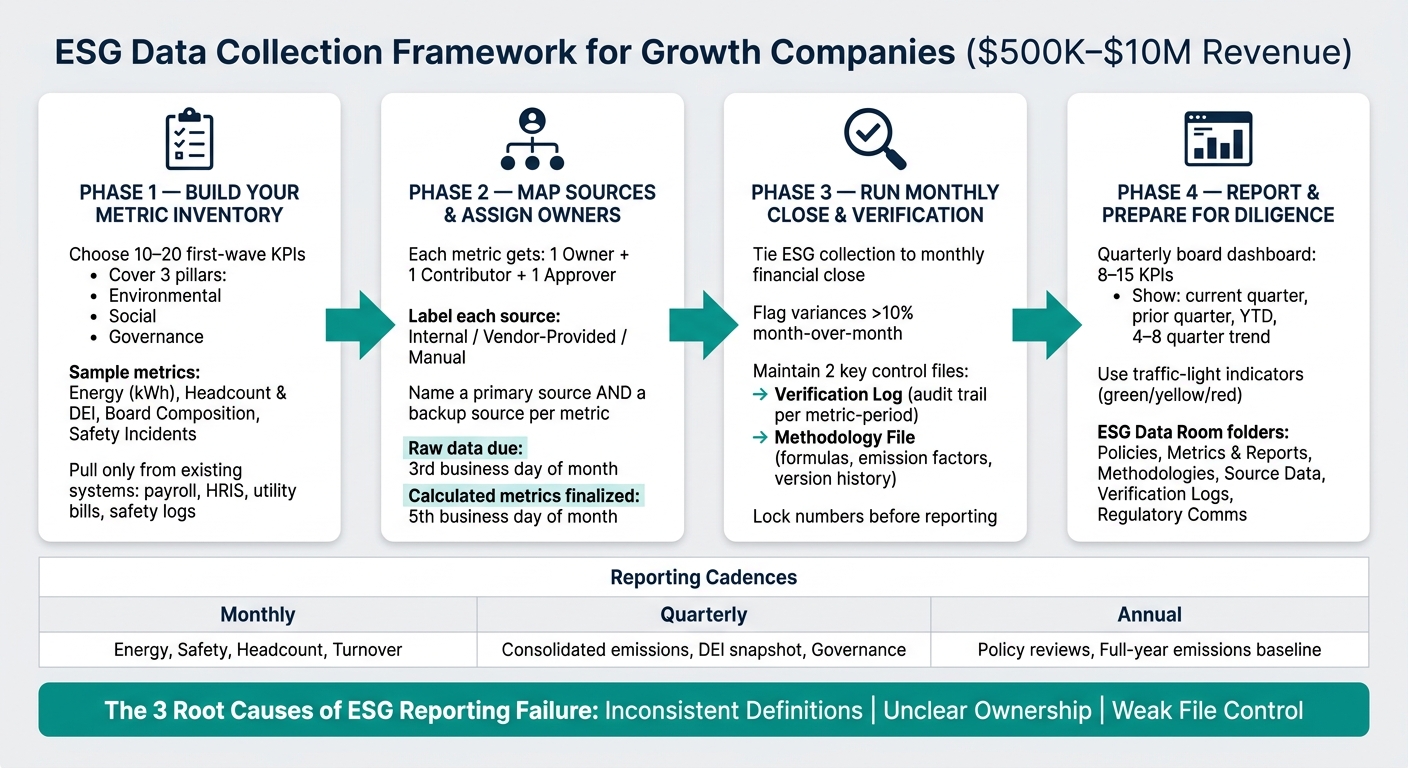
ESG Data Collection Process for Growth Companies: A Step-by-Step Framework
| Area | What to do |
|---|---|
| Metrics | Choose 10–20 first-wave KPIs |
| Ownership | Assign one owner, one reviewer, one approver |
| Sources | Use one system of record per metric, plus a backup source |
| Timing | Tie ESG collection to the monthly and quarterly close |
| Checks | Run variance review and reconcile to payroll, bills, board records, or the GL |
| Proof | Save invoices, exports, logs, signed minutes, and policy files |
| Reporting | Build a board dashboard with 8–15 KPIs and trend lines |
| Diligence | Store all support in a clean ESG data room |
If I were setting this up, I’d treat ESG like a mini close process: inventory first, ownership second, monthly review third, board reporting last.
Start by defining your first-wave metrics before you build the collection process. Think of this as an ESG chart of accounts: lock in the numbers first, then assign owners. Use the same discipline you’d use for the monthly close, and keep the first wave tight. Stick with metrics you can pull from records you already have, like payroll, utility bills, HR systems, safety logs, and board materials.
For most U.S. growth companies, a good first-wave inventory includes a focused set of metrics across Environmental, Social, and Governance. Here’s a practical starting point:
| Category | Metric | Unit |
|---|---|---|
| Environmental | Total electricity consumption | kWh per facility |
| Environmental | Natural gas / fuel use | Therms or gallons |
| Environmental | Scope 1 GHG emissions (company vehicles, fuel) | Metric tons CO₂e |
| Environmental | Scope 2 GHG emissions (purchased electricity) | Metric tons CO₂e |
| Environmental | Water consumption | Gallons per site |
| Environmental | Waste generation and recycling rate | Pounds or short tons |
| Social | Total headcount (full-time vs. part-time) | Number of employees |
| Social | Voluntary and involuntary turnover | % per month |
| Social | New hires and time-to-hire | Count and days |
| Social | Workforce diversity (gender, race/ethnicity) | % of total workforce |
| Social | OSHA recordable and lost-time incidents | Count per period |
| Social | Compliance training completion rate | % by employee group |
| Governance | Board composition (independent directors) | Count and % |
| Governance | Board gender and racial diversity | % of board seats |
| Governance | Core policy status: whistleblower, privacy, anti-discrimination, code of conduct | Yes/No + last review date |
Map each metric to one system of record. That matters more than it may seem. If one team pulls headcount from payroll while another uses an HR dashboard, you’re asking for mismatched numbers. Once the inventory is set, document each metric so every reviewer works from the same definition.
Every metric needs a short metric card. Nothing fancy. Just enough so people know exactly what they’re looking at and how it should be reported.
Each card should include:
For example: "Total electricity consumption: grid electricity used at owned and leased sites, reported monthly in kWh."
Use this cadence:
Not every metric deserves the same level of attention, especially if your team is small. A simple way to sort the list is to rate each metric on three factors: operating cost impact, risk exposure, and how often it shows up in lender, investor, or M&A requests.
Metrics that score high across all three should make the first cut. That usually includes energy use, headcount and turnover, basic diversity data, safety incidents, board composition, compliance training, and policy records.
More involved data sets, like detailed Scope 3 emissions or supplier sustainability questionnaires, can wait. Get the base inventory working first. Then build from there.
The next step is mapping each chosen metric to a source and owner.
Once your metric inventory is set, the next step is to turn that list into a working process. For each metric, answer three basic questions: Where does the data live? Who gets it? When does it need to be ready?
For every metric, name a primary source and a backup source.
The primary source is the system you use every reporting period. The backup source is what you use if the main source shows up late or comes in with gaps. It’s a simple step, but it can save a lot of scrambling later.
Here’s what that can look like across the three ESG pillars:
| Metric | Primary Source | Backup Source | Source Type |
|---|---|---|---|
| Electricity consumption (kWh) | Monthly utility invoice | Smart meter log or utility portal export | Vendor-provided |
| Natural gas use (therms) | Utility bill | Building management system export | Vendor-provided |
| Waste volume (short tons) | Waste hauler invoice | Internal facilities log | Vendor-provided |
| Headcount and diversity | HRIS report | Payroll system export | Internal |
| Training completion rate | LMS report | Signed attendance sheets | Internal |
| Health and safety incidents | Safety incident log | Internal incident log | Internal |
| Board independence | Board minutes and appointment resolutions | Corporate secretary's tracking spreadsheet | Manual |
| Policy adoption dates | Legal's contract management system | Policy library in shared drive | Manual |
Label each source as internal, vendor-provided, or manual. Manual sources need the closest review because they usually leave more room for missed entries, version mix-ups, or plain old human error.
Once each metric has a source, assign the owner and approver.
Use a simple three-role model for every metric: one owner, contributors, and one approver.
The owner should sit with the team that controls the source system. That person is accountable for turning in the metric on time and using the agreed method. Contributors provide the raw inputs. The approver checks the metric before it goes into any report.
In practice:
When more than one department touches the same data, give ownership to the function that controls the underlying drivers. For example, if travel emissions show up in both the expense management platform and a travel agency statement, the owner should be the team that controls the travel activity itself.
Use a RACI matrix so each metric has one owner, clear contributors, and one approver.
With roles in place, lock down the submission calendar and file rules.
Tie ESG submissions to your existing monthly close calendar. Follow these four rules:
ESG_Energy_2026-06_EntityA_v1.xlsx to keep version control clean and trace any board-facing number back to its source file.Use the same entity names, site IDs, and department codes that already appear in your ERP and HRIS. Also keep units consistent: kWh for electricity, therms for gas, short tons for waste, and miles for travel.
These standards feed the monthly close and verification steps in the next checklist.
These rules make monthly collection, close, and verification repeatable.
Once your metrics and owners are set, the next step is simple: make ESG part of the monthly close. Give it owners, due dates, and evidence rules. In practice, that means using the same owner list and the same deadlines your finance team already follows.
Run the ESG data pass right after the general ledger and trial balance review. Close the core financials first. Then move into ESG collection so the team is working from a closed period, not a moving target.
During the monthly close, complete the following:
The quarterly close adds consolidation and deeper review. Calculate quarterly metrics like energy per $1,000 of revenue, turnover, and incident rate per 100 FTEs. Reconcile energy to occupancy and headcount to payroll. If any formulas, emission factors, allocation rules, or boundaries changed during the quarter, update the methodology file.
Run a month-over-month variance review at the same time as your financial variance analysis. Flag any energy usage shift greater than 10% from the prior month, unexpected zero-incident periods where that is statistically unlikely, or headcount changes that do not match payroll. [1][4][2] Write down every flag, the reason behind it, and how it was resolved before the ESG data is locked.
Lock the numbers in the verification log before they move into reporting.
Think of the verification log as the audit trail for every ESG number in a report. For each figure, capture the metric name and period, the source document - such as a utility bill or HRIS export - the data owner and contributor, the checks performed, the reviewer's name and review date, any corrections made, and the approver.
Missing source documents - such as a utility bill supporting electricity use - can fail assurance. [3][5]
Keep the log in a shared file with one row for each metric-period combination. Add data validation rules like metric-name drop-downs, status fields (final, estimated, provisional), and required dates so entries stay consistent. Make log completion a required step before any ESG figure can show up in a board report.
The methodology file is your policy file for ESG metrics. It should spell out the exact formulas, the emission factors used with their source and effective date, allocation rules for shared resources, and the estimation approach used when data is missing. It also needs a version change log. Any time a formula, emission factor, or boundary changes, record what changed, why it changed, who approved it, and the effective date. That keeps ESG numbers steady from one period to the next.
This file becomes the source of truth for board reporting and diligence.
Use the checklist below to assign each metric, source, and control. Treat this table as the monthly control sheet - the control layer behind board-ready outputs.
| Metric | Source System | Data Owner | Reporting Frequency | Evidence Retained | Verification Checks |
|---|---|---|---|---|---|
| Electricity usage (kWh) | Utility provider portal | Office Manager / Facilities Lead | Monthly | Utility bill PDF, meter export | Compare to prior 3-month average; reconcile billing period to close period |
| Natural gas use (therms) | Utility bill / BMS export | Facilities Lead | Monthly | Utility bill PDF | Flag >10% MoM change; confirm facility coverage |
| Water consumption (gallons) | Utility bill | Facilities Lead | Monthly | Utility bill PDF | Check for zero usage at occupied sites |
| Fleet / travel fuel (gallons, miles) | Expense platform / travel agency | Finance / Operations | Monthly | Expense report export, travel agency statement | Reconcile to expense GL; confirm unit consistency |
| Total headcount & DEI breakdown | HRIS (e.g., Gusto, Rippling) | HR Manager | Monthly | HRIS report export with timestamp | Match headcount to payroll; confirm demographic fields complete |
| New hires & terminations | HRIS | HR Manager | Monthly | HRIS report export | Reconcile to payroll additions/removals |
| Recordable safety incidents | Incident reporting log | Operations / Safety Lead | Monthly; ad hoc for incidents | Signed incident forms | Confirm OSHA filings match internal log; check date and location fields |
| Training completion rate | LMS or HRIS | HR Manager | Quarterly | LMS report export | Confirm denominator (eligible employees) matches headcount |
| Board meetings & resolutions | Board portal / board minutes | Corporate Secretary | Quarterly; when meetings occur | Signed board minutes | Confirm quorum, resolution dates, and policy adoption records |
| Policy adoption & updates | Legal / contract management system | Legal / Corporate Secretary | Quarterly | Policy documents with effective dates | Verify version control; confirm distribution records |
Update this table any time you switch systems, add a new facility, or bring in a new metric.
Once the verification log and methodology file are done, move from data collection to reporting. The goal here is simple: give boards, investors, lenders, and buyers numbers they can use, with clear support behind every figure.
Start with the verified metrics from Checklist 3.
Keep the dashboard tight. For a growth-stage company, a solid ESG board dashboard usually includes 8–15 clearly defined KPIs tied to financial performance, risk, and capital planning. Group them into three or four panels: Environment, People, Governance, and Key Risks.
For each KPI, show:
Use traffic-light indicators - green, yellow, or red - to flag anything that falls outside target ranges.
Then add a short narrative next to the KPI panels. That narrative should cover three things: what changed, what it means for the business, and what action comes next. Make the link to money and risk obvious. If turnover goes up, recruitment costs may rise. If energy efficiency improves, operating expenses may fall.
Each KPI should also link back to its source file, owner, and approval trail in the dashboard footer. Directors and investors should be able to trace every number back to its source, logic, and approval trail.
After the board dashboard is in place, package the source files for diligence and fundraising.
A good ESG data room makes it easy to find the files buyers and investors ask for most. It should mirror your financial and legal data room, with clearly labeled ESG subfolders:
Use YYYY-MM-DD file names so the timing is obvious at a glance. For example: 2026-03-31_ESG_Board_Dashboard_Q1.pdf. That makes it much easier for investors and buyers to find support tied to a specific reporting period. [6][7]
In the U.S., investors, lenders, and buyers often ask for workforce data, permits, incidents, compliance records, prior ESG reports, and board decks. Annual ESG summary packs can save a lot of back-and-forth when those requests come in.
Pick a reporting cadence based on what the board needs, how solid the data is, and how much the team can handle. Most $500K–$10M companies should begin with quarterly board ESG reporting backed by monthly internal tracking for higher-risk or higher-impact metrics such as safety incidents, turnover, and energy use. [6]
| Cadence | Advantages | Drawbacks | Best Fit | Typical Metrics |
|---|---|---|---|---|
| Monthly | Tight alignment with financial close; fast detection of spikes in energy use or turnover; supports active operational management | Higher workload; requires clean data flows and more automation | Fast-growing companies with strong finance operations and frequent board or lender updates | Energy use (kWh), emissions estimates, headcount, turnover, safety incidents, diversity pipeline |
| Quarterly | Balances insight and workload; aligns with board meetings and most investor reporting cycles | Slower visibility into emerging risks; some trends may be masked | Most $500K–$10M companies with lean teams | Consolidated emissions, turnover rate, diversity snapshot, governance updates |
| Annual | Lowest workload; suitable for very early-stage companies or those establishing a first ESG baseline | Limited usefulness for operational decisions; can miss emerging risks entirely | Companies with minimal ESG pressure or a first-year baseline effort | Full-year emissions inventory, annual diversity and engagement surveys, policy reviews |
Use the lightest cadence that still gives the board enough information to make sound decisions and maintain reliable controls.
The goal is repeatable ESG reporting, not perfection. Start with a small first-wave inventory made up of metrics you can collect, verify, and report every month. The process is simple: build the inventory, map sources, assign owners, verify the data, and report.
Each metric should tie back to one clear source and one person who owns it. For every metric, assign:
That setup helps keep ESG numbers from turning into figures nobody can explain.
Next, bring ESG into the monthly close. Treat it like financial data. Collect inputs on a set schedule, reconcile them to source records, document variance explanations, and keep a simple verification log plus a methodology file for each metric.
Once the data is verified, turn it into reporting the board can use. A concise quarterly dashboard works well, with monthly updates for metrics tied to risk, cost, or strategy. If you're preparing for fundraising or M&A, set up an ESG data room with metrics, methodologies, policies, and supporting documents.
Use the first 30 days to build the metric register. Use the next 30 days to run ESG through close and draft methodology files. Use the final 30 days to refine the dashboard and present it to the board.
Start small, document everything, and scale the process each cycle.
Start with a cross-functional team that includes Finance, Legal, HR, and Operations. The goal is simple: identify the ESG topics that matter to your business.
Build a long list of 20 to 40 topics. Use SASB or ISSB to find issues tied to financial materiality, and use GRI to cover broader stakeholder impacts. That gives you a list grounded in both business risk and outside impact.
Next, score each topic on two separate scales:
Score them separately so one factor doesn’t blur the other. Then use those scores to narrow the list down to 8 to 15 material topics.
It also helps to set a clear cutoff, like 3 out of 5. That makes the process easier to explain and helps reduce subjective bias.
ESG data collection should sit with a cross-functional team that brings together Finance, Legal/Compliance, HR, Operations, and Investor Relations. Give each metric a clear owner so the process is handled with the same discipline as financial reporting.
It also helps to name a project lead who can make decisions, remove roadblocks, and work directly with senior leadership. On top of that, put board-level oversight in place to review methodologies and help keep reporting aligned with regulation.
Keep records that are clear, easy to trace, and linked back to the original source documents. For environmental reporting, that usually means utility bills, logistics contracts, and facility reports. For social metrics, hold on to HR records, supplier audits, and litigation logs. For governance, keep board minutes, policy histories, and training logs.
This matters even more as rules like CSRD and SB 253 start to demand more proof behind what companies report. If third-party assurance comes into play, scattered files and half-documented numbers can turn into a mess fast. A central, traceable system helps keep the evidence in one place, so reporting stays defensible and consistent over time.



