Published on
September 9, 2026


If your close still takes 10–20 days, your dashboard is too late to help. I’d build this kind of pipeline by starting with the metrics first, then connecting billing, ERP, CRM, payroll, and bank data in that order, and only using live updates where delay changes a decision.
Here’s the short version:
Most finance reporting does not need second-by-second updates. In practice, batch processing covers about 80% of reporting needs, while hourly or intra-day sync matters more for cash position, collections, failed payments, and sales changes.
A simple way to think about it: accuracy first, speed second. If I can’t trace a number back to its source, I wouldn’t put it on a live dashboard.
For a quick view, here’s how I’d split the pipeline:
| Area | What I’d do |
|---|---|
| Metrics | Start with cash, burn, runway, ARR, collections, payroll run rate, and pipeline-to-bookings |
| Source order | Billing → ERP → CRM → Payroll → Bank feeds |
| Refresh speed | Daily for GL/payroll; hourly or near-live for cash, billing, and CRM |
| Warehouse setup | Raw layer → cleaned layer → finance marts |
| Controls | Schema checks, reconciliations, rollup checks, and visible “Last updated” timestamps |
| Rollout | Parallel run through one close cycle, then phased access |
So the core idea is simple: I’d work with a fractional CFO to build a pipeline that gives leaders same-day visibility into cash and revenue, while keeping accounting data tied back to one source of truth.
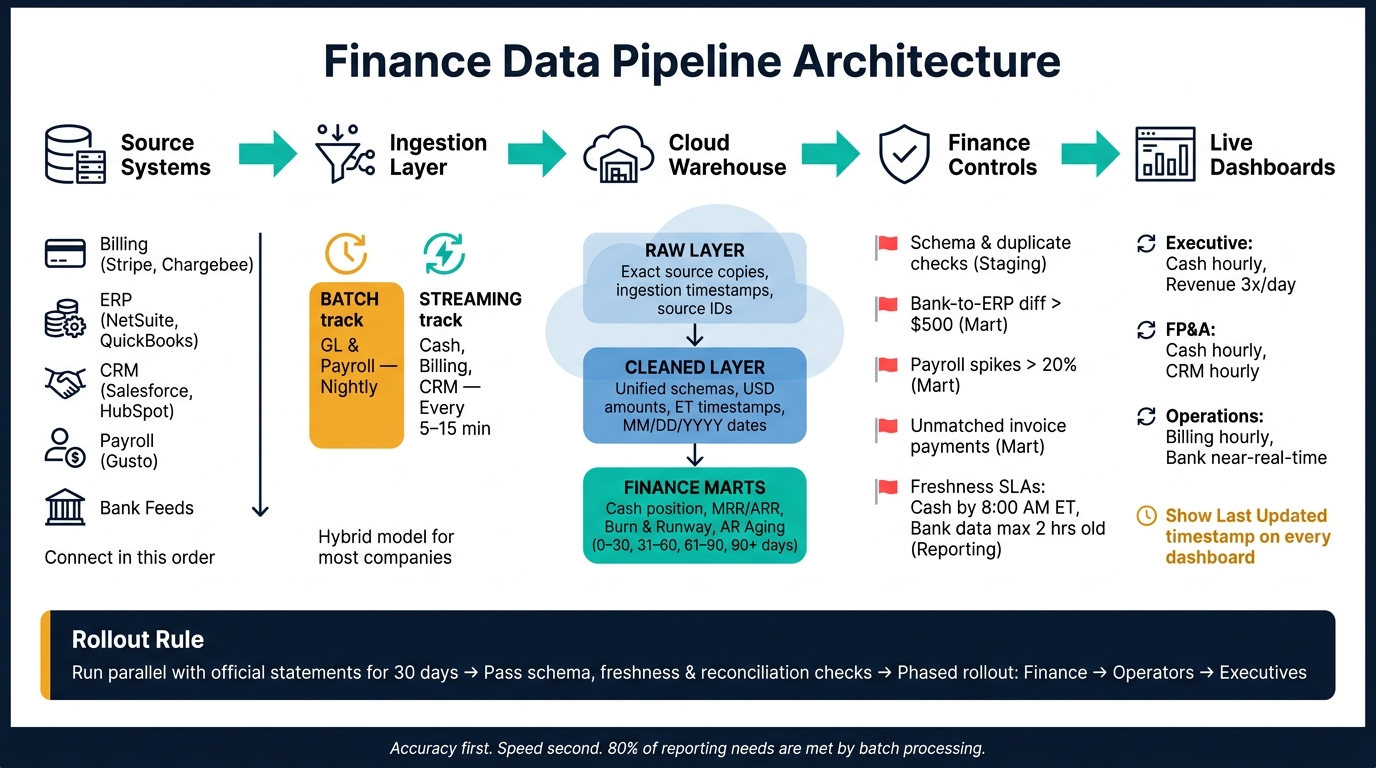
Finance Data Pipeline Architecture: From Source Systems to Live Dashboards
A clean finance data stack usually follows a simple path: source systems feed an ingestion layer, data lands in a central cloud warehouse, then moves through a transformation layer before it shows up in BI dashboards. Each part has a clear role - connector, warehouse, transformation layer, and BI layer.
ERP and payroll data - journal entries, accruals, and payroll runs - tend to close on daily or monthly cycles. So a nightly batch refresh from NetSuite or QuickBooks Online is often enough.
Other sources move faster. Billing events from Stripe or Chargebee, CRM updates from Salesforce or HubSpot, and bank transactions can support intraday reporting. Those usually work better with streaming or micro-batch ingestion every 5–15 minutes.
For most growth-stage companies, the sweet spot is a hybrid model. ERP and payroll stay on a steady nightly schedule. Faster-moving sources stream in when intraday visibility matters. Then metrics like MRR, burn, and runway refresh hourly. That setup keeps the close process steady while still giving leadership a live look at cash and revenue - last-closed financials and real-time signals in one dashboard.
| Approach | Latency | Implementation Effort | Operational Control | Best-Fit Finance Use Cases |
|---|---|---|---|---|
| Batch | Minutes to 24 hours | Low - scheduled ETL/ELT jobs or cron scripts | High - easy to pause, re-run, and reconcile | Month-end close, board reporting, statutory financials, weekly cash forecasts |
| Streaming | Seconds to a few minutes | High - event-driven architecture, webhooks, message queues | Moderate - more moving parts, harder to reconcile | Cash balance monitoring, transaction-level risk monitoring, same-day sales metrics |
| Hybrid | Near real-time for select sources; daily for others | Moderate - stream critical sources, batch the rest | High for batch sources; moderate for streamed sources | Executive dashboards, live cash plus last-closed financials, AR collections alerts |
Once refresh speed is set, the next move is to separate raw, cleaned, and reporting layers inside the warehouse.
After data reaches the warehouse, it should pass through three clear layers before a dashboard touches it. If you skip the raw layer, you usually end up with tech debt. It also makes change management and quality checks much harder.
The raw layer holds exact copies of source data with only light changes, usually just enough to standardize column names and data types. Each source keeps its own tables, such as raw_stripe_charges, raw_netsuite_invoices, raw_qbo_invoices, raw_gusto_payroll_runs, and raw_hubspot_deals. Every record should keep an _ingested_at timestamp and the original source ID, like stripe_charge_id or netsuite_invoice_id, so any number in a report can be traced back to where it came from.
The cleaned layer turns those raw tables into shared invoice, payment, payroll, and customer schemas. For example, one invoice table can pull together records from NetSuite, QuickBooks Online, and Chargebee under the same structure. That schema might include invoice_id, source_system, customer_id, issue_date, due_date, invoice_amount_usd, and status. Amounts stay in USD. Dates are stored internally as ISO timestamps and then shown as MM/DD/YYYY in dashboards.
The finance marts are the tables dashboards actually query. That might mean:
All amounts should stay in USD. And the business logic inside these marts should be approved by finance leadership before it gets anywhere near a dashboard. That extra layer of control helps source-system changes from spilling into reporting logic.
Phoenix Strategy Group helps growth-stage companies define the right metrics, keep source data clean, and build the pipeline end to end. That kind of alignment makes it easier to connect ERP, billing, payroll, CRM, and bank feeds in the right sequence.
Once your warehouse structure is set, connect data sources in the order that makes reconciliation simpler.
Start with billing. Pull invoice, subscription, and payment data from your billing system first. Keep the first pass tight: total invoiced revenue, cash collected, MRR/ARR, and aged AR by customer. Then check those numbers against the billing platform’s native reports for one to two close cycles.
Add ERP second. Treat ERP as the source of truth for recognized revenue, gross margin, and operating expenses. Tie those figures back to the billing data you already checked. Any timing differences, credits, and deferrals should be tracked on their own.
After billing and ERP are steady, add CRM so you can connect pipeline and bookings to actual billings. Then bring in payroll to show headcount and compensation costs as key burn drivers. This level of visibility is a core component of fractional CFO services for scaling companies. Load bank feeds last, once the earlier systems reconcile cleanly.
That sequence helps limit dashboard drift. Your fastest-moving metrics sit on top of revenue and cash numbers you’ve already checked. Once the source order is locked in, standardize how the systems connect to each other.
Standardize customer IDs, timestamps, and USD fields before you build dashboard metrics. If you skip this step, the same customer, transaction, or balance can show up differently across dashboard tiles.
Build a master customer dimension table that stores each system’s native ID along with one canonical customer key. Include legal entity name, EIN, and billing address so your matching rules have enough signal. For unclear matches, use manual review.
Convert all timestamps to ET in the warehouse, and keep the original timestamp for auditability. Then build metrics and cutoffs from the standardized timestamp.
For currency, convert all amounts to USD in the cleaned layer using documented FX rates:
Also classify bank transactions as ACH, wire, check, or card. That makes cash reporting cleaner and helps with anomaly detection.
With sources normalized, the next step is to set refresh rules and automate the handoffs.
Once your sources are normalized, the next step is simple: set refresh rules based on the decision each dashboard needs to support.
That means timing should follow decision speed, not what the system can technically do. Payroll and GL usually work fine on a batch schedule. Bank and cash data are different. If a treasury or finance team needs to manage cash during the day, overnight bank files won’t cut it. They can be a full day behind. API connections shrink that delay to minutes.
A good rule here: use the slowest refresh cadence that still fits the decision window. Faster isn’t always better. It often just adds cost, noise, and more things that can break.
Here’s a practical way to map cadence by dashboard type:
| Source | Executive | FP&A | Operations |
|---|---|---|---|
| Bank / cash | Hourly to near-real-time | Hourly | Hourly to near-real-time |
| Billing / revenue | Several times per day | Several times per day | Hourly |
| CRM / pipeline | Several times per day | Hourly | Hourly |
Payroll and GL / ERP should stay on a daily schedule or follow the close cycle.
After cadence is set, make it stick with dependency-based orchestration.
In plain English, the flow should work like this:
That order matters. If you skip it and rely on a blind clock-based schedule, you’ll end up with partial updates and mismatched numbers. One dashboard may show fresh cash data while revenue is still stale. Another may refresh before transformation finishes. That’s how leaders lose trust fast.
Business SLAs should read like business commitments, not system notes. For example:
Alert routing matters too. Send freshness alerts to the team that owns the pipeline, not to a big shared channel where everybody gets pinged for every small delay. That kind of setup burns people out fast, and then the alerts start getting ignored.
And one more thing: every dashboard should show a visible Last updated timestamp. No one should have to stop and wonder whether the numbers on screen are current.
Once refresh timing is set, the next step is simple: check every update before it hits the dashboard.
A good mental model is this: each layer in the pipeline has its own job. Staging should catch structural issues. Transformation should catch finance logic issues. Reporting should catch anything that could mislead executives or investors.
Use the same raw, cleaned, and finance-mart layers as control points.
| Layer | Primary Checks | What It Should Catch |
|---|---|---|
| Staging (Ingestion) | Schema checks, required fields, duplicate source keys, and stale-data checks | Missing columns, type changes, duplicated invoices or payments, and stale feeds before they enter the warehouse |
| Transformed (Finance Mart) | Cash reconciliation, invoice-payment matching, payroll variance checks, matching IDs across systems, and currency/time-zone normalization | Cash that does not tie to bank statements, unmatched invoices, payroll spikes without explanation, and misaligned IDs across systems |
| Reporting (Dashboards) | Freshness SLAs, KPI reconciliation, rollup checks, and anomaly flags | Stale dashboards, ARR that does not reconcile to accounting, impossible margins, and unexplained swings in revenue and margin metrics |
Set hard flags for a few high-risk cases:
Before executive rollout, run the dashboard in parallel with official statements. Put it through one full close cycle, log every discrepancy, and go live only after schema, freshness, and reconciliation checks pass for 30 days. After that, start with finance, expand to a small group of operators, and then move to full executive rollout, often managed by a startup CFO.
A live dashboard only works when finance KPIs are defined in accounting terms and tied back to one source of truth. Every number should have a documented key and a reconciliation that closes. Near-real-time refresh should be reserved for high-velocity indicators like collections, cash receipts, or sales performance. Otherwise, speed just pushes bad numbers out faster.
Once accuracy and trust are in place through layered checks, documented definitions, and visible freshness indicators, shorter refresh intervals become a safe next step. The order matters: source systems first, normalization second, validation third, speed last.
If your team needs help wiring the systems and reconciliation logic, Phoenix Strategy Group provides data engineering plus fractional CFO and FP&A support.
Start with financial data integration. Connect your ERP, accounting software, CRM, and banking platforms first. That gives your dashboards one clean, trusted source of truth.
Once that flow is stable, automate repetitive, high-impact tasks like daily cash flow reporting, account reconciliation, and anomaly detection. Save more advanced analysis and forecasting for later.
Your dashboard should refresh only as fast as your team can act on the data. If nobody’s making a decision in the next few minutes, faster updates don’t add much.
For many growth-stage businesses, daily updates are enough. Dashboards that track cash or risk may need a 15-minute lag or less. Some B2B services can work fine with weekly reviews. Whatever cadence you choose, add clear freshness labels and timestamps.
Create a single source of truth by syncing billing, CRM, and general ledger data automatically. Add validation rules that flag issues like missing values or negative numbers before they hit the dashboard.
During the monthly close, reconcile each feed to actuals. Give every KPI a clear owner, document standard formulas, and keep human review steps in place to catch mismatches that automation can miss.