Published on
August 29, 2026


Freemium growth only works if each paid customer covers three things: acquisition cost, their own service cost, and the cost of free users who never pay.
If I had to boil this down to the numbers that matter most, I’d watch these every month:
Here’s the simple test:
A few benchmark points stand out:
One formula matters more than most: LTV = ARPU × Gross Margin % ÷ Monthly Churn Rate. Another one keeps freemium honest: blended CAC should be measured per paying customer, not per signup.
I’d also keep one hard limit in mind: if your free-user cost is too high relative to conversion and ARPU, a cohort can lose money before CAC is paid back.
| Metric | What I’d use it for | Simple warning sign |
|---|---|---|
| Conversion rate | Shows how many free users become payers | Too low = each payer carries more cost |
| Blended CAC | Shows total acquisition burden per payer | Rising faster than ARPU |
| Gross margin | Shows how much revenue is left after service cost | Free tier pulls it down |
| LTV | Shows expected gross profit from a paid user | Falls fast when churn rises |
| CAC payback | Shows how long it takes to earn CAC back | Over 18 months can strain cash |
| Cohort margin | Shows whether a signup cohort makes money | Negative after free-user cost and CAC |
So if I were building or reviewing a freemium model, I would not start with top-line signup growth. I’d start with cohort conversion, cost to serve free users, and payback by channel. That’s where the truth is.
Freemium only works when the gross margin from paid users covers two things: what it costs to get users in the door and what it costs to serve the free tier.
That means you need to model three numbers with care:
Then pressure-test each cohort. If a cohort can't pay back acquisition cost plus service cost, the model starts to wobble.
At its core, the test is pretty simple: do the margins from paying users cover the cost of acquiring users and supporting free users?
If free-to-paid conversion goes up, the math gets better. If gross margin is strong, that helps too. But a permanent free tier can drag out payback, because paid gross margin isn't just carrying paid users. It also has to carry the free-user load.
The median overall gross margin for private SaaS companies is 77%.[1] That's a handy benchmark, but only if your COGS is fully loaded. In plain English, that means it should include cloud infrastructure, hosting, and support costs for both free and paid users.
To model freemium the right way, track the full funnel from signup to paid conversion, along with monthly service cost. The main inputs break down like this:
Cohort and channel cuts matter here. When you group users by signup cohort and acquisition channel, you can see whether each cohort ever covers acquisition cost plus the cost of serving free users.
That also helps you spot a common problem: blended numbers can hide weak channels. One channel may convert well but cost more to serve. Another may look cheap up front but never pay back. These inputs feed the blended CAC and LTV formulas that follow.
Free-to-paid conversion changes the math of customer acquisition in a big way. In a freemium model, if fewer users convert, each paying customer has to carry more of the cost created by free users. That means blended CAC goes up because the same acquisition, hosting, and support spend gets spread across a smaller group of payers.
This is why funnel math matters so much. It turns cohort behavior into blended CAC you can actually model.
Use these as monthly cohort inputs in your FP&A model:
These rates stack on top of each other FAST. A small lift in activation or paid conversion can cut the number of visitors and free users needed to get one paying customer.
But here’s the catch: this math only helps if you tie it to cohort-level cost, not broad company averages.
Standard CAC is still sales and marketing spend divided by new paying customers. In a freemium setup, blended CAC takes that same spend and adds free-user service costs, then spreads it across only the users who become paying customers. So the metric to watch is CAC per payer, not CAC per signup.
It also helps to track a couple of step-by-step metrics alongside blended CAC:
These give you a clearer read on where money is being spent before any revenue shows up.
When conversion drops, you need more free users to get each payer. And that means more cloud, storage, and support cost tied to each dollar of revenue.
At a 2% free-to-paid conversion rate, you need 50 free users to get one paying customer. At 6%, you need about 17. That gap hits paid cohort margin directly.
Typical signup-to-paid conversion runs from 2.6% to 5%, while top-quartile products hit 8% to 12% [2]. Activation is the strongest early signal of where conversion is likely to land. Median activation sits at 52%, and top performers clear 90% [2].
Put simply: weak activation usually makes everything downstream more expensive.
Channel mix matters just as much as the top-line conversion rate. Some channels bring in users who are ready to act. Others bring volume, but not much follow-through.
Organic and product-led traffic often brings higher-intent users at a lower acquisition cost. Paid channels can drive more signups, but those users often convert at a lower rate. Sales-assisted motions usually start with fewer free signups, yet they can convert qualified leads at a much higher clip.
That’s why you want to measure conversion by signup cohort, not only by acquisition source. If you don’t, CAC can look better than it is.
| Channel | Cost Driver | Relative Conversion | Where Blended CAC Rises |
|---|---|---|---|
| Organic / Product-Led | Onboarding and tooling cost | Generally stronger | Blended CAC stays low if activation is strong |
| Paid Acquisition | Media spend per signup | Generally weaker | Blended CAC inflates quickly if conversion lags |
| Sales-Assisted / PQL-driven | Sales labor cost per deal | Typically higher | Higher per-customer cost, but stronger conversion can offset free-user burden |
Those channel-level gaps feed straight into LTV and payback.
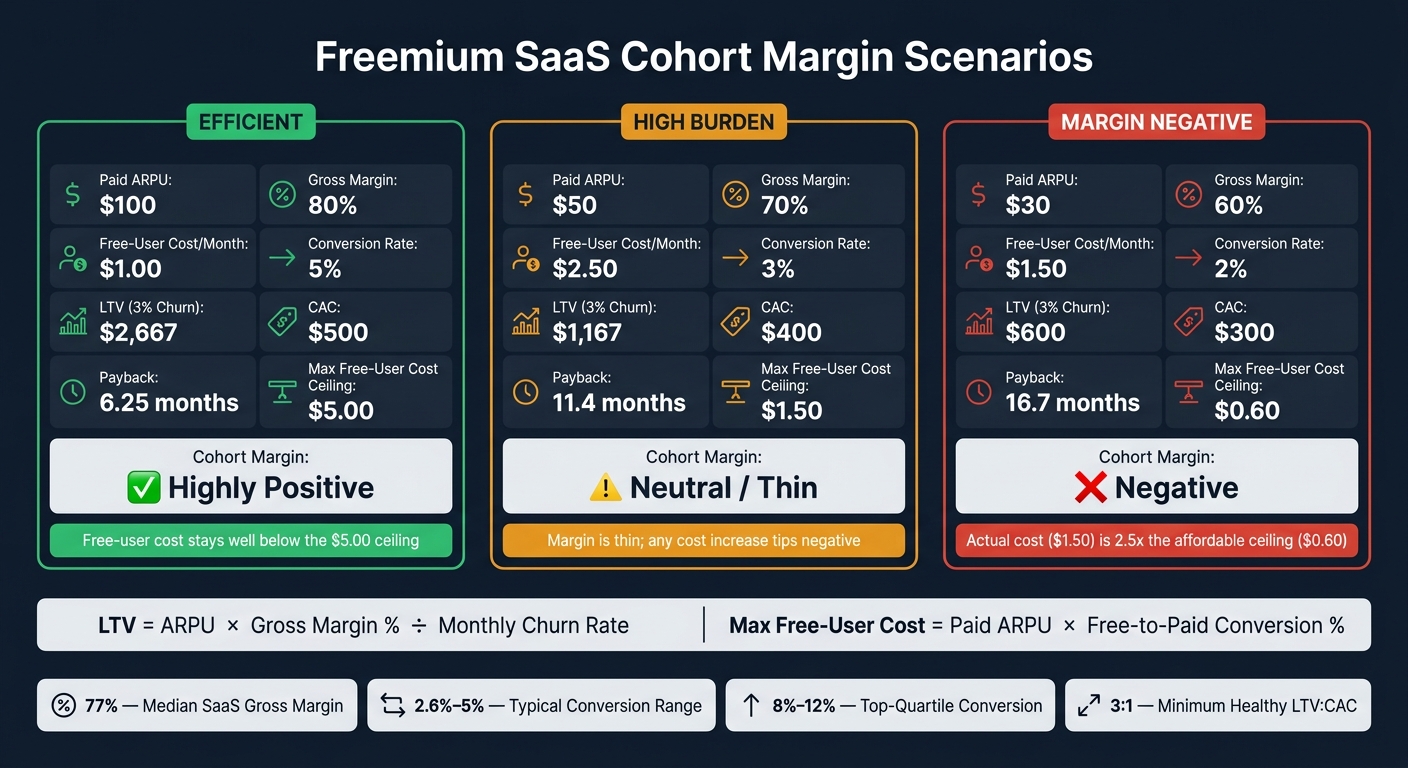
Freemium SaaS Unit Economics: Cohort Margin Scenarios Compared
Once conversion changes CAC, the next step is simple: can each cohort pay back both acquisition and service cost? That's the part teams sometimes miss. Conversion doesn't just change CAC. It also changes how fast a cohort earns that money back.
LTV = ARPU × Gross Margin % ÷ Monthly Churn Rate [1]
One common mistake is using revenue instead of gross profit. If you sell a $100 plan at an 80% gross margin, your LTV model should use $80 in monthly gross profit, not $100 in revenue.
For freemium, run this math for the converted cohort on its own. If you mix freemium-converted users with direct-paid customers, the numbers get muddy fast.
CAC payback uses that same gross-margin-adjusted revenue base:
CAC Payback (months) = CAC ÷ (Monthly ARPU × Gross Margin %) [1]
The median CAC payback for B2B SaaS is 15 to 18 months, while top companies aim for under 12 months [1]. A healthy SaaS business also aims for an LTV:CAC ratio of at least 3:1 [1]. Again, calculate these figures separately for converted freemium users and direct-paid customers.
Even a small drop in churn can lift LTV in a big way. That's one lever founders often overlook when they're focused on acquisition spend.
These figures then become the main assumptions in your cohort model.
Free users still cost money. Every active free account uses compute, storage, bandwidth, email sends, API calls, and support time. Those costs should sit in COGS, along with cloud infrastructure, hosting, support staff, payment processing, and third-party software [1].
Max Free-User Cost = Paid ARPU × Free-to-Paid Conversion % [1]
That formula gives you a hard ceiling.
If your free-user cost goes past that limit, the cohort is margin-negative before CAC is even paid back.
Costs can also swing a lot by segment. One segment may cost $3.40/month to serve, while another comes in at $14.80/month [1]. If you're only staring at one blended cloud bill, you won't see that gap. Tracking cost per customer and cost per segment is what separates a model that looks fine on paper from one that holds up in practice.
Next, pressure-test those limits with cohort scenarios and see where margin flips negative.
These hypothetical scenarios show how conversion, ARPU, margin, and free-user cost shape cohort-level economics, not company-wide averages. The same ARPU can lead to very different outcomes depending on conversion rate and free-user cost. Scenarios are hypothetical for illustrative purposes based on 2026 benchmark data [1] [2].
| Scenario | Paid ARPU | Gross Margin % | Free-User Cost/Month | Conversion Rate | LTV (3% Churn) | CAC | Payback (Mo) | Cohort Margin |
|---|---|---|---|---|---|---|---|---|
| Efficient | $100 | 80% | $1.00 | 5% | $2,667 | $500 | 6.25 | Highly Positive |
| High Burden | $50 | 70% | $2.50 | 3% | $1,167 | $400 | 11.4 | Neutral/Thin |
| Margin Negative | $30 | 60% | $1.50 | 2% | $600 | $300 | 16.7 | Negative |
The Efficient scenario works because the free-user cost stays far below the $5.00 ceiling, and the gross margin lets the cohort recover CAC in short order. The Margin Negative scenario breaks down for three reasons at once: low ARPU, weak margin, and free-user cost that pushes the affordable ceiling down to just $0.60, well below the $1.50 actual cost.
Use those thresholds to set the assumptions in the driver-based FP&A model next.
Turn your cohort margin scenarios into a monthly driver model that changes as conversion, churn, and cost assumptions move. The scenarios are not the forecast itself. They’re the inputs that feed it. Think of them as the first layer of your driver tree.
Use monthly signup cohorts as your base unit. Then track each cohort month by month, from signup to activation, then PQL stage, paid conversion, churn, and expansion.
Tie each cohort back to its acquisition channel so CAC stays broken out at the source. Blended CAC can blur the picture and hide which channels are pulling their weight. Once users convert to paid, roll those cohorts into an NRR model that tracks starting MRR, plus expansion, minus contraction and churn [2]. Expansion needs to sit inside that NRR bridge because it can materially offset the freemium acquisition burden [2].
This setup gives you a clean way to see whether a cohort pays back before you make the next spend call.
Before you put more dollars into acquisition, run base, upside, and downside cases across the inputs that matter most:
Churn deserves extra pressure-testing because even small shifts can change LTV and payback in a big way. A 0.5% monthly churn improvement can lift LTV by 33%, but payback can still hurt cash flow if it runs past 24 months [1].
The point isn’t just prettier ratios on a spreadsheet. It’s knowing whether a cohort can scale without straining cash flow. If the downside case breaks payback or margin, hold off on scaling spend.
Once the model structure is in place, the next pain point is usually clean cost data. That’s where this gets messy. Cohort-level cost data often lives in different systems, shows up late, or doesn’t line up cleanly.
Phoenix Strategy Group builds integrated FP&A models for growth-stage SaaS teams, linking bookkeeping, fractional CFO support, and data engineering so CAC, LTV, and cohort margin stay visible in one system.
Once you run the cohort math, the test gets pretty simple: freemium only works when lifetime gross profit is higher than acquisition cost and the cost to serve free users. Every cohort needs to pay for itself over time. Whether that happens comes down to four numbers: conversion, ARPU, churn, and gross margin.
That’s why blended CAC should be tracked per payer, not per signup. In a freemium model, blended CAC is sales and marketing spend plus free-user service cost, divided by new paying customers.
From there, cohort margin becomes the pass/fail test. It shows which channels and segments earn back acquisition and service cost, and which ones don’t. If you want the clearest read on whether freemium growth can scale, this is it.
The operating rule is simple: review conversion, ARPU, gross margin, and churn every month before you scale acquisition.
A typical freemium model turns about 3.7% of free signups into paying customers, though that number can shift based on the product and the market. Strong products sometimes hit 8% to 12%.
Freemium usually leans on high signup volume, so a lower conversion rate isn't always a red flag. The bigger issue is whether those conversions support a healthy LTV/CAC ratio of at least 3:1 and a CAC payback window of 12 to 18 months.
Divide total sales and marketing expenses by the number of new paying customers acquired in the same period, not total free-user signups.
Blended CAC = Total Sales & Marketing Expenses / New Paying Customers Acquired
Include all acquisition-related costs, such as:
If you want a fully loaded view, also allocate hosting and support costs tied to free users.
Compare a free user’s lifetime cost with the money you expect that user to bring in over time.
Here’s the basic math:
This gives you a simple way to check whether your free tier makes business sense. If a free user costs more to serve than they’re likely to generate, the model starts to strain.
That problem gets worse when support and infrastructure costs climb but conversion stays low. For example, if free-user support adds $20.00 to $60.00 per year, the numbers can get ugly fast. And if it takes hundreds of free users to produce a single paid account, your free plan may be costing more than it gives back.