Published on
August 30, 2026


If your SaaS company is around $500,000 to $10,000,000 in ARR, spreadsheets stop being enough. I’d move planning into an FP&A setup when version issues, slow closes, broken formulas, and mixed KPI definitions start affecting ARR, hiring, cash, and board reporting.
Here’s the short version:
One stat stands out: finance teams spend 46% of their time collecting and checking data when spreadsheets run planning. That’s time not spent on forecast changes, hiring tradeoffs, or runway questions.
Here’s what matters most:
I see the shift as less about software and more about control. When the model is connected, you can test growth plans, hiring moves, and downside cases without rebuilding files by hand.
Before you move data out of spreadsheets, set the rules for the planning system. If you skip that step, you just move the same mess into a new tool.
A solid FP&A setup pulls actuals into one place, uses the same metric rules across the business, and lets leadership see runway, ARR, and hiring impact without chasing manual file updates. Put simply: you want one source of truth. Actuals should update on their own, metrics should be defined once and reused everywhere, and leaders should be able to see the effect of hiring plans and revenue changes without finance rebuilding files by hand.
From there, lock down the metrics and data rules the model will run on.
SaaS planning starts to fall apart when teams use different KPI definitions. Your CFO may show one number, investor materials another, and sales reporting something else entirely. This lack of alignment is often why companies hire a fractional CFO to standardize financial management. That’s how confusion creeps in.
Start with a metrics dictionary. For each metric, document:
| Metric | Standard Definition |
|---|---|
| MRR | Total predictable subscription revenue generated each month from active customers; clarify whether discounts and one-time fees are included |
| ARR | MRR × 12; clarify treatment of annual prepayments and multi-year contracts |
| Gross Churn | Lost recurring revenue from cancellations and downgrades ÷ starting recurring revenue |
| Net Revenue Retention (NRR) | (Starting MRR + Expansion − Contraction − Churn) ÷ Starting MRR |
| CAC | Fully loaded sales and marketing spend ÷ new customers acquired in the same period |
| CAC Payback | CAC ÷ monthly gross profit per customer |
| LTV | ARPA × gross margin ÷ monthly churn rate |
| Burn Rate | Net burn = total cash out − total cash in per month |
| Runway | Current cash balance ÷ monthly net burn |
| Headcount | Define whether you count FTEs only, contractors, or open roles, and apply the rule consistently |
Keep that dictionary in one shared location. Then bake those definitions into monthly reporting so finance, leadership, and investors are all working from the same logic. Once the rules are fixed, the next job is figuring out which spreadsheet problems are doing the most damage.
Not every spreadsheet issue deserves the same attention. Focus first on the ones that create conflicting numbers, drag out month-end updates, or force finance to reconcile several versions of the truth.
The usual trouble spots are familiar:
These aren’t small annoyances. They can lead to unclear runway, off-track hiring, stale forecasts, and investor materials that tell different stories. A SaaS company scaling from $5 million to $10 million in ARR that adds five sales reps without updating its cash model can watch runway drop from 18 months to 12 months before anyone spots it.
That’s why the first fixes should tie straight to runway visibility, hiring decisions, and investor reporting. Those are the FP&A requirements worth building first.
The new process should do more than clean up reporting. It should connect the parts of the business that usually live in separate files.
Integrated actuals means your general ledger, billing system, CRM, and payroll data flow into one model each month automatically. Driver-based revenue planning means your ARR forecast is built from inputs like lead volume, conversion rates, win rates, pricing tiers, seat counts, and logo churn, instead of a top-down growth percentage.
Workforce planning means a headcount change in any department flows straight into payroll costs, benefits, burn rate, and runway. Scenario versioning means you can compare Base, Upside, and Downside cases side by side and see the effect on ARR, burn, and runway without rebuilding the model from scratch.
Monthly board reporting means your investor package - MRR/ARR waterfall, NRR, CAC, CAC payback, LTV, burn multiple, and runway - is produced the same way every time and ties back to your GAAP financials.
With those requirements in place, the next move is mapping your current spreadsheets into a connected model.
Before you rebuild anything, map every active file and data source. That's how you see what's still in use, what's broken, and what should move first.
Growth-stage SaaS teams usually run more planning files than they think. It's common to see separate workbooks for the annual budget, rolling forecast, ARR waterfall, churn analysis, CAC and LTV model, headcount plan, cash forecast, and investor reporting pack. And in most cases, there isn't just one version. There are several floating around at the same time.
For each file, document four things:
Then rank each file by its effect on ARR, runway, and investor reporting. That last field matters most. If the ARR waterfall still depends on manual CSV exports from billing and often fails to match recognized revenue, you've got a clear first target for automation.
| Model | Current State | Breakpoints | FP&A Target State |
|---|---|---|---|
| ARR Waterfall | Manual CSV imports | Manual updates; broken formulas | Automated data feed; standardized ARR logic by segment |
| Churn Analysis | Analyst-maintained tab | Cohort definitions differ from customer success team | Cohort-based module with locked definitions |
| Headcount Plan | HR/Finance spreadsheet; updated quarterly | New hires added late; salary assumptions go stale | Integrated workforce planning by role and department |
| Cash Forecast | Standalone workbook; limited driver linkage | Doesn't reflect hiring changes until month-end | Linked to revenue, expenses, and headcount |
| Investor Reporting Pack | Manually assembled each month | Manual tie-outs to core models | Auto-generated from the same connected model |
Use this inventory to spot which files can be retired and where automation will do the most work.
Once you know what exists today, define the structure that will replace it. A connected FP&A model depends on standardized dimensions. Think of these as the shared labels that let every sub-model work from the same logic.
At a minimum, lock down these dimensions: time (month, quarter, year), department, cost center, product line, customer segment (SMB, mid-market, enterprise), legal entity, measure type (actuals, budget, forecast), and scenario (base, downside, aggressive growth).
When those dimensions stay consistent, month-end and quarter-end reviews get much cleaner. You can compare actual enterprise ARR against budget by product line, layer in churn by cohort, and trace the effect on cash runway without rebuilding reports or reconciling separate files. Board reporting and scenario updates stay tied to the same model instead of drifting apart.
This is where many spreadsheet setups fall apart. ARR sits in one tab, headcount in another, and the cash forecast lives somewhere else. Nothing updates together.
Each SaaS driver should feed the P&L, cash flow statement, and runway view. ARR by product line and segment should flow into subscription revenue and cash collections. Churn and expansion changes should update future ARR rows, then flow through revenue and cash projections. CAC from sales and marketing cost centers should map to operating expense lines and calculate payback period automatically. The headcount plan - with role, department, hire date, salary, benefits, and payroll taxes - should post into personnel costs and monthly cash outflows.
Add five enterprise account executives in Q4, and the model should instantly show the effect on burn, runway, and cash-out date. You just can't get that kind of visibility when these inputs sit in separate files.
Use this map to choose the first model to migrate.
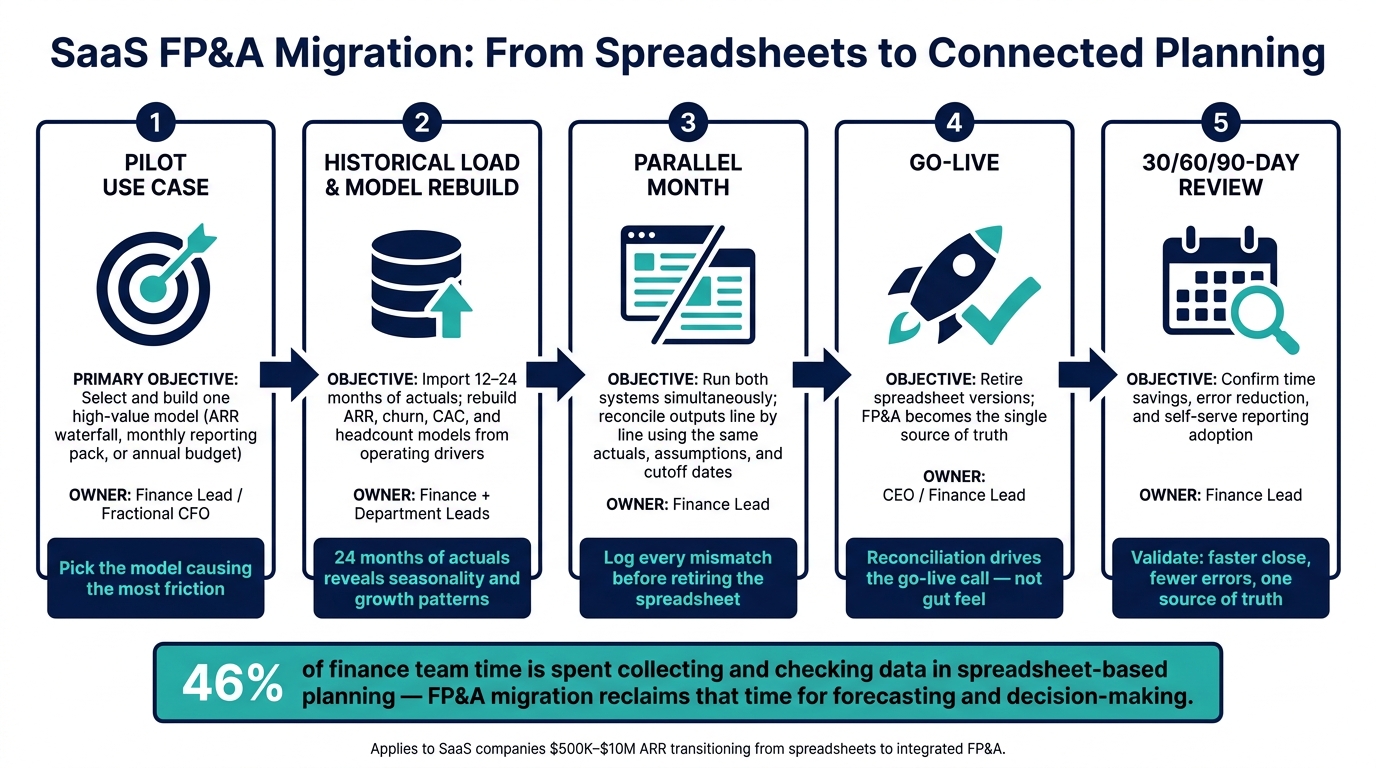
SaaS FP&A Migration: From Spreadsheets to Connected Planning
Once you’ve mapped your spreadsheet inventory, move the highest-value workflow first. A phased migration helps keep your numbers dependable during the switch. If you replace every spreadsheet at the same time, small mistakes can snowball across revenue, hiring, and cash forecasts. In SaaS, that risk is even higher because ARR, churn, CAC, and headcount all move together.
Start with one model leadership leans on all the time - the one already causing the most friction. Pick the model that has the clearest effect on ARR, churn, CAC, LTV, or runway.
Good first candidates include:
Then rank each option by a few simple factors: visibility, how often it needs updates, cross-team dependency, and spreadsheet pain.
A good first pilot shows value fast and helps people trust the new system.
Load at least 12 months of actuals, and 24 months is better, to spot seasonality, growth patterns, and recurring variances [2][3]. That’s the point where the model stops being just a spreadsheet copy and starts working like a driver-based FP&A system.
Make sure the imported data lines up with your chart of accounts, department structure, product lines, and customer segments. If that setup is messy, plan vs. actual comparisons will get messy too from day one.
Then rebuild the core models from operating drivers instead of fixed assumptions. Revenue should come from ARR, new bookings, churn, expansion, and contraction. Go-to-market models should tie pipeline, conversion rates, CAC, and payback together so you can test spend by scenario. Workforce planning should include role, department, salary, benefits, start date, and ramp timing. Leave one of those out, and cash needs can look lower than they are.
Write down the logic behind CAC and LTV before migration. That way, every assumption is plain, traceable, and easier to defend when someone challenges the method.
Run both systems side by side for at least one full reporting cycle using the same actuals, assumptions, and cutoff dates. Build the monthly close, forecast update, and investor reporting pack in both systems, then compare the outputs line by line.
Use the monthly reporting pack as the main test case. Log every mismatch, trace the cause, and fix it before you retire the spreadsheet. The reconciliation should drive the go-live call - not gut feel.
Use the sequence below to keep ownership and cutover timing clear.
| Phase | Objective | Owner |
|---|---|---|
| 1 - Pilot Use Case | Select and build one high-value model | Finance Lead / Fractional CFO |
| 2 - Historical Load & Model Rebuild | Import historical actuals and rebuild ARR, churn, CAC, and headcount models | Finance + Department Leads |
| 3 - Parallel Month | Run both systems and reconcile outputs line by line | Finance Lead |
| 4 - Go-Live | Retire spreadsheet versions; FP&A becomes source of truth | CEO / Finance Lead |
| 5 - 30/60/90-Day Review | Confirm time savings, error reduction, and self-serve reporting | Finance Lead |
Keep the old spreadsheets as reference-only files during parallel testing. After reconciliation, stop updating them.
Once the migration is done, FP&A should help you make faster calls, clean up reporting, and send investor updates from one set of numbers. The model shouldn’t just explain what happened. It should help you test what to do next.
The ARR, churn, CAC, LTV, headcount, and runway drivers already built into the model are what make scenario planning useful. Each scenario changes those same core inputs - new bookings, churn rate, pricing, sales capacity, hiring pace, and fundraising timing - and the outputs flow through ARR, expenses, cash, and runway.[10][18][19]
That separation matters. Keep drivers separate from outputs. If you change win rate, the model should recalculate ARR growth, CAC payback, and runway on its own.[17][19]
A simple scenario grid may look like this.
| Scenario | ARR Growth (YoY) | Churn Rate (Annual) | CAC Payback (Months) | Runway (Months) | Planned Headcount (Year-End) |
|---|---|---|---|---|---|
| Base | 35% | 10% | 18 | 18 | 75 |
| Upside | 50% | 7% | 14 | 24 | 85 |
| Downside | 20% | 13% | 24 | 12 | 65 |
The downside case is usually where the model proves its worth. If slower bookings and higher churn pull runway down to 12 months, you can test trade-offs right away - delay noncritical hires, cut marketing spend, or move fundraising forward - and see the runway effect in real time.[17][20]
The same model should power the monthly investor pack, too. A strong monthly pack should come together automatically.[13][14][15]
At a minimum, the monthly package should include:
Close by the fifth business day, review the numbers internally, then send a 5- to 10-slide update or a short email within a few days.[4][5][6] Lead with MRR/ARR and runway.[7][8][9] In practice, steady formatting and a predictable send date often do more for trust than any single KPI.
A mature FP&A process gives you one monthly source of truth for ARR, MRR, churn, CAC, LTV, and net dollar retention, tied to U.S. GAAP financials. That replaces spreadsheet upkeep with a repeatable system for planning and investor reporting.[11][12] Phoenix Strategy Group provides fractional CFO, FP&A, bookkeeping, data engineering, and M&A support for growth-stage companies.
A SaaS company should move from spreadsheets to dedicated FP&A tools when manual updates, forecasting, and data reconciliation across CRM, billing, and ERP systems start taking too much time and leading to mistakes.
Common signs include:
Start with a driver-based revenue model, especially a bottom-up MRR model that tracks new logos, expansion, contraction, and churn. That gives you a forecast tied to how the business actually runs, instead of leaning on broad top-down growth rates.
Once you have that revenue waterfall in place, you can add headcount plans, CAC, LTV, and cash runway with a lot more confidence.
Use a single source of truth by syncing your CRM, billing system, and general ledger into one auditable database. Keep bookkeeping on an accrual basis so revenue is recognized across contract terms, not when cash happens to come in.
Set clear definitions for ARR, NRR, and CAC, then use those exact definitions in your investor slides. Reconcile data every month against actuals, add human review, and make sure internal alerts and board reporting rely on the same metrics.



