Published on
August 13, 2026


If I want the best sale price for a contract manufacturer, I need more than a good EBITDA number. Buyers check whether earnings are clean, how much cash the business needs to keep running, how much room the plant has, and how risky the customer base looks.
Here’s the short version:
A few numbers stand out:
If I were getting ready to sell, I’d focus on five things first: clean EBITDA, capex history, working capital trends, plant headroom, and customer stickiness. That’s where price often moves up or down.
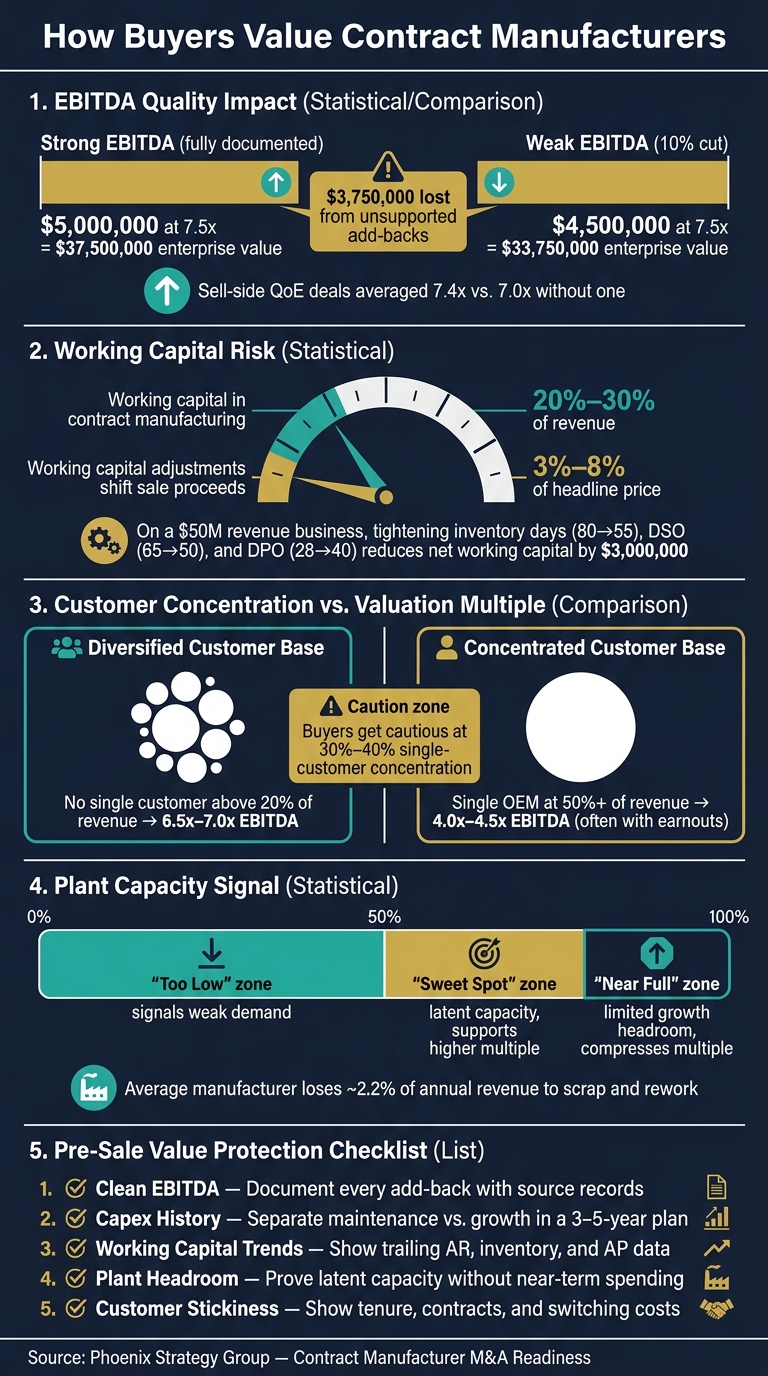
How Customer Concentration & EBITDA Quality Affect Contract Manufacturer Valuation Multiples
This is where valuation starts to shift. Buyers rebuild EBITDA from the ground up and remove any adjustment they can't prove.
A 10% cut - from $5.0 million to $4.5 million - reduces enterprise value by $3.75 million at 7.5x. And the damage often goes past the math. If add-backs look aggressive or vague, buyers may start to doubt the rest of the numbers too. That can push the multiple lower as well.
Buyers don't take adjusted EBITDA at face value. They rebuild it from the records, line by line. Each add-back has to be real, non-recurring, and documented.[5][6]
They usually pull 24 to 36 months of monthly data. If a cost shows up again and again, it gets reversed right away.[1][7] Chronic overtime, scrap, and rework are part of normal operations, not add-backs. The same goes for projected savings from automation or contract changes that haven't happened yet. If the savings are still on paper, buyers won't count them.
Only narrow, documented items tend to hold up in diligence. A one-time legal settlement can survive if there are invoices, an engagement letter, and proof the dispute is closed. That's the rule in plain English: if it's not documented and one-time, it usually gets cut.
| Add-Back Category | What Survives Diligence | What Gets Cut |
|---|---|---|
| Owner compensation | Excess above documented market rate | Vague "management adjustment" with no benchmark |
| One-time legal or professional fees | Resolved one-time dispute with invoices | Ongoing outside counsel labeled as "project" |
| Personal expenses | Specific items traced to GL and receipts | Broad estimates without transaction-level detail |
| Non-recurring operational events | Discrete one-off event (e.g., flood repair) | Recurring inefficiencies called "one-time" |
| Future savings | N/A - buyers reject these entirely | Projected synergies, unimplemented cost cuts |
A defensible EBITDA bridge is a line-by-line waterfall that takes buyers from reported EBITDA to adjusted EBITDA, with each adjustment tied to a specific GL account, invoice batch, payroll run, or contract reference.[1][3][4] Put simply, it should be a schedule a buyer can audit without guessing.
Start with reported EBITDA for the last twelve months. Then list each normalization item on its own line with a short description, dollar amount, and document reference. Also include a line that removes any earlier add-backs that don't survive a hard review. That shows discipline, and it keeps the bridge clean.
Your monthly close also needs to be consistent. In the chart of accounts, separate direct labor, indirect labor, repairs, capex, and overhead. And don't hide detail inside "miscellaneous" buckets.[2][3] Those buckets tend to set off alarms because they force buyers to dig for the story.
Once EBITDA looks solid, buyers usually turn to capex and working capital to see how much cash the business actually produces.
After buyers rebuild EBITDA, they pressure-test how much cash the business actually throws off after maintenance capex and working capital.
Maintenance capex is the recurring cash needed to keep current equipment, facilities, and compliance standards running. Growth capex is different. That spending adds capacity or new capabilities.
Buyers subtract maintenance capex when they look at free cash flow, then model growth capex on its own. So if a contract manufacturer reports $5,000,000 of EBITDA but needs $2,000,000 a year in maintenance capex, buyers won’t value the company on EBITDA alone. They’ll value it based on the cash left after that maintenance spend.[15]
Deferred maintenance makes things worse. When buyers spot downtime, aging equipment, scrap, or an open repair backlog, they usually assume higher future capex and use a lower multiple.[18][19] That’s the deal math version of a warning light on the dashboard.
The fix is pretty simple: build a 3–5-year capex schedule that labels each project as either maintenance or growth, backed by engineering reports, vendor quotes, and compliance needs.[9][19] Founders who complete focused maintenance work 12–24 months before going to market and document the results - uptime stats, audit scores, defect rates - give buyers a clean baseline instead of another risk item to price in.
Once capex is normalized, buyers move to working capital to see how much cash is still tied up in day-to-day operations.
Working capital has a direct effect on value because buyers use a peg to adjust the price at closing. Net working capital pegs show up in over 90% of private M&A deals,[14][16] and in contract manufacturing - where working capital often sits at 20% to 30% of revenue - that matters a lot.
Buyers usually review 12–24 months of month-end balances for:
From there, they calculate inventory days, DSO, and DPO to set a target peg. If actual working capital at close comes in below that target, the purchase price gets cut dollar-for-dollar.[10][11][12] In lower middle-market deals, working capital adjustments often move sale proceeds by 3% to 8% of headline price.[13]
This is why small operating changes can have a big effect on what sellers take home. Cutting inventory, collecting faster, and stretching supplier terms can lower the peg and reduce the odds of a price haircut at close.
Here’s what that can look like in plain numbers:
On a $50,000,000 revenue business, tightening inventory days from 80 to 55, DSO from 65 to 50, and DPO from 28 to 40 can reduce net working capital from $11,000,000 to $8,000,000 - a $3,000,000 improvement that directly lowers the peg and reduces the risk of a negative price adjustment at close.
Founders should document exactly what changed. For example, if the business put vendor-managed inventory in place or moved customers to standard 45-day payment terms, that should be spelled out. It also helps to show trailing 12-month trends so buyers can see the new numbers are holding steady, not just a last-minute cleanup before signing.
Once buyers pressure-test cash needs, they usually zero in on two operating risks that shape the multiple: Can this plant grow in a steady way? And will revenue still be there after the deal closes? If the answer to either one is shaky, the multiple can slide even when EBITDA looks strong.
Capacity matters because it shows how much EBITDA can grow before the business needs more spending.
Buyers don’t put much weight on nameplate capacity. They look at practical capacity instead, based on run hours, changeover time, downtime, scrap, and staffing. Many also use OEE, which rolls availability, performance, and quality into one throughput score.[26][28]
Both ends of the range can cause trouble.
A plant running far below capacity can make buyers wonder whether demand is weak or whether the commercial side isn’t doing its job. A plant running close to full can signal limited room for growth, which can push the multiple down.[27] What buyers want to see is documented headroom: room to grow without near-term capex.
Scrap often gets brushed aside, but it hits harder than many founders think. The average manufacturer loses around 2.2% of annual revenue to scrap and rework,[25][28] and that chips away at both margins and usable capacity. Buyers will spot it in diligence anyway, so it’s smarter to measure it first and show that the trend is moving the right way.
A simple U.S.-focused capacity table might look like this:[17]
| Production Line | Current Utilization | Practical Capacity / Constraint | Potential EBITDA |
|---|---|---|---|
| Line A – automated filling and packaging | 65% practical utilization | 2 × 8-hour shifts; 1.5% scrap; up to 25% additional volume before needing new equipment | About $500,000 in annual EBITDA |
| Line B – filler-constrained line | 90% practical utilization | Single filler; 0.8% scrap; requires a $750,000 filler investment | About $400,000 to $600,000 in EBITDA |
That split matters. Latent capacity is not the same as growth that depends on buying more equipment. Buyers pay more for latent capacity because the payoff comes sooner and the risk is lower.[17]
Capacity tells buyers how much the plant can produce. Customer stickiness tells them whether that output will still have a home after closing.
Customer risk matters because buyers pay for revenue they think will survive the handoff.
Customer concentration is one of the first things buyers flag in contract manufacturing diligence.[20][23] The issue isn’t just how many customers the business has. It’s whether the revenue will last. Could a top account rebid the work, bring it in-house, or shift volume after the deal closes?[29][30]
Buyers usually get cautious when one customer makes up roughly 30% to 40% of total revenue, or when the top three customers account for more than 60% to 70%.[22][24] But concentration by itself doesn’t decide the discount. Switching costs matter more. Think custom tooling, regulatory qualifications, long reorder histories, or deep links with the customer’s planning systems.[29][31]
The best way to handle this is with account-level detail. Show buyers which revenue is sticky and why.
| Customer | % of Revenue | Gross Profit Contribution | Contract Term | Renewal History | Key Switching-Cost Factors |
|---|---|---|---|---|---|
| Customer A | 28% | 32% of total GP | 5-year supply agreement with automatic 2-year renewals | In place since 2013 | Custom tooling, FDA process validation (12–18 months to replicate) |
Founders can use the same format for the rest of the top accounts. That shifts concentration from a red-flag headline into a more grounded risk profile.
Buyers pay for durable cash flow, not just EBITDA. So every figure you put forward - adjusted EBITDA, maintenance capex, working capital, plant utilization, and customer concentration - will get pushed on before anyone agrees to a multiple.
That’s where the price gap usually shows up: preparation.
A contract manufacturer with no single customer above 20% of revenue can support 6.5x–7.0x EBITDA. One that depends on a single OEM for 50%+ of revenue may trade closer to 4x–4.5x EBITDA, and those deals often come with earnouts.[32]
That’s why the final 6 to 12 months before a sale carry so much weight. It gives you time to clean up the financials, document add-backs the right way, normalize working capital, and put together the schedules buyers expect to see.
Use this pre-sale checklist:
| Workstream | What to Fix | Why It Matters |
|---|---|---|
| Adjusted EBITDA | Build a 12- to 24-month EBITDA bridge with source docs for every add-back | Unsupported add-backs get cut[36][37] |
| Maintenance capex | Separate maintenance from growth in a 3- to 5-year capex plan | Buyers haircut EBITDA if equipment looks underinvested[15][8] |
| Working capital | Show trailing AR, inventory, and AP trends | Avoids surprise price reductions at close[34][38] |
| Plant capacity | Show utilization, shifts, and expansion headroom | Latent capacity supports a stronger multiple[21][35] |
| Customer durability | Show tenure, contract terms, margins, and switching costs | Durable revenue reduces buyer discount pressure[23][33] |
When EBITDA is clean, cash needs are normalized, and operating headroom is easy to see, valuation becomes much easier to defend.
A conservative, well-supported story usually beats an optimistic one. Founders who build the data first tend to deal with fewer retrades, fewer price chips at close, and a more competitive sale process.
Phoenix Strategy Group works with founders during this pre-sale window to build that base - clean financials, defendable EBITDA bridges, and M&A readiness support built around the questions buyers are likely to ask before they ask them.
The goal is simple: make sure the business’s actual value comes through clearly, and keep avoidable issues from getting in the way of the number you’ve earned.
Buyers want primary-source documentation that links every add-back to the financial records. That usually means items like receipts, invoices, bank or credit card statements, payroll records, and signed documents such as settlement or severance agreements.
Each item should line up with a specific general ledger account and reporting period. Add a short written note that explains what the expense was for and why it belongs there. For owner compensation, include W-2s along with market-rate salary benchmarks.
Watch your DSO and the cash tied up in inventory, work-in-progress, and receivables. If sales keep growing faster than your ability to turn those assets into cash, your working capital peg may be set too high.
Integrated dashboards that link production planning with cash forecasting can show whether working capital lines up with what the business actually needs - or whether too much of it is just sitting on shelves.
Buyers often treat high customer concentration as a serious risk, and that can drag down valuation.
Here’s the simple version: if one customer accounts for more than 20% to 25% of revenue, buyers may reduce the valuation multiple by 0.5 to 3.0 turns. If a single customer makes up more than 50%, the EBITDA multiple may drop by 1.5 to 3.0 turns.
The same logic applies when revenue is clustered across a small group of accounts. If the top three customers generate more than 40% of revenue, buyers often see that as risky and may push for earnout structures.
Why does this matter so much? Because heavy reliance on a small number of customers can make future cash flow feel less stable. If even one account leaves, the business can take a hard hit almost overnight.



