Published on
September 11, 2026


Revenue can go up while cash gets tight. I’d boil the whole article down to this: OpEx hurts cash flow when money goes out before customer payments come in.
Here’s what matters most:
A few numbers make the risk clear: about 82% of business failures are tied to cash flow problems, and the median U.S. small business has only around 27 days of cash buffer. That means even a good month on the P&L can still lead to a cash crunch.
So when I think about OpEx during growth, I don’t just ask, “How much am I spending?” I ask:
If I can answer those four questions every week, I’m in a much better spot to protect runway and avoid a mid-month cash shortfall.
The main issue is timing: cash leaves the business before customer cash shows up.
Payroll, rent, cloud bills, and ad spend usually hit on set dates. Customer payments often land 30 to 60 days later. So a strong P&L can still hide a tight bank balance in the middle of the month. A monthly P&L can show $500,000 in revenue and $350,000 in expenses, which looks like a healthy $150,000 profit [5]. But if most invoices went out on the last day of the month on Net 30 terms, the cash may not arrive until late the next month, while payroll and rent have already cleared on the 1st and 15th [4][7].
That gap hits the cash calendar first, not the P&L. On paper, things look fine. In the bank account, it can feel a lot tighter.
Growth-stage companies usually deal with two OpEx layers at the same time: fixed costs and variable costs.
Fixed OpEx - salaries, benefits, office leases, and committed software contracts - doesn't change with revenue. This is the fixed monthly burn: the minimum cash the business has to spend each month no matter what happens. If monthly salaries and benefits total $300,000, rent is $40,000, committed SaaS and infrastructure contracts are $25,000, and debt service is $10,000, the fixed monthly burn is $375,000 per month [9][3][1]. If a deal gets delayed or a campaign falls flat, that number stays the same.
Variable OpEx - ad spend, sales commissions, payment processing fees, and usage-based cloud costs - sits on top of that base. These costs can jump fast. A campaign launch or a traffic spike can double a variable cost without bringing in cash right away. That's where things get tricky: fixed costs go up because of new hires and new commitments, while variable costs jump because the company is testing for growth.
It’s a bit like pressing the gas while the road ahead is still foggy. Spend moves now. Cash may show up later.
Customer payment terms create a built-in cash gap, and that gap gets bigger as revenue grows.
The formula is simple: Payment Terms Gap (days) = Customer credit terms − Supplier credit terms [13]. If a company collects on Net 60 but pays vendors on Net 30, it carries a 30-day gap that has to be covered with cash on hand or credit. As enterprise buyers keep pushing for Net 60 or Net 90 terms to manage their own working capital [10][11][12][14], that gap gets wider, and the seller ends up carrying the burden.
At $1,000,000 in monthly sales on Net 60, about $2,000,000 sits in receivables at any given time [6][8]. That cash can't be used for payroll, vendors, or other OpEx. So even while revenue grows, runway can shrink. Longer payment terms lock more cash in receivables and put more pressure on liquidity.
These are the gaps burn and runway models need to measure next.
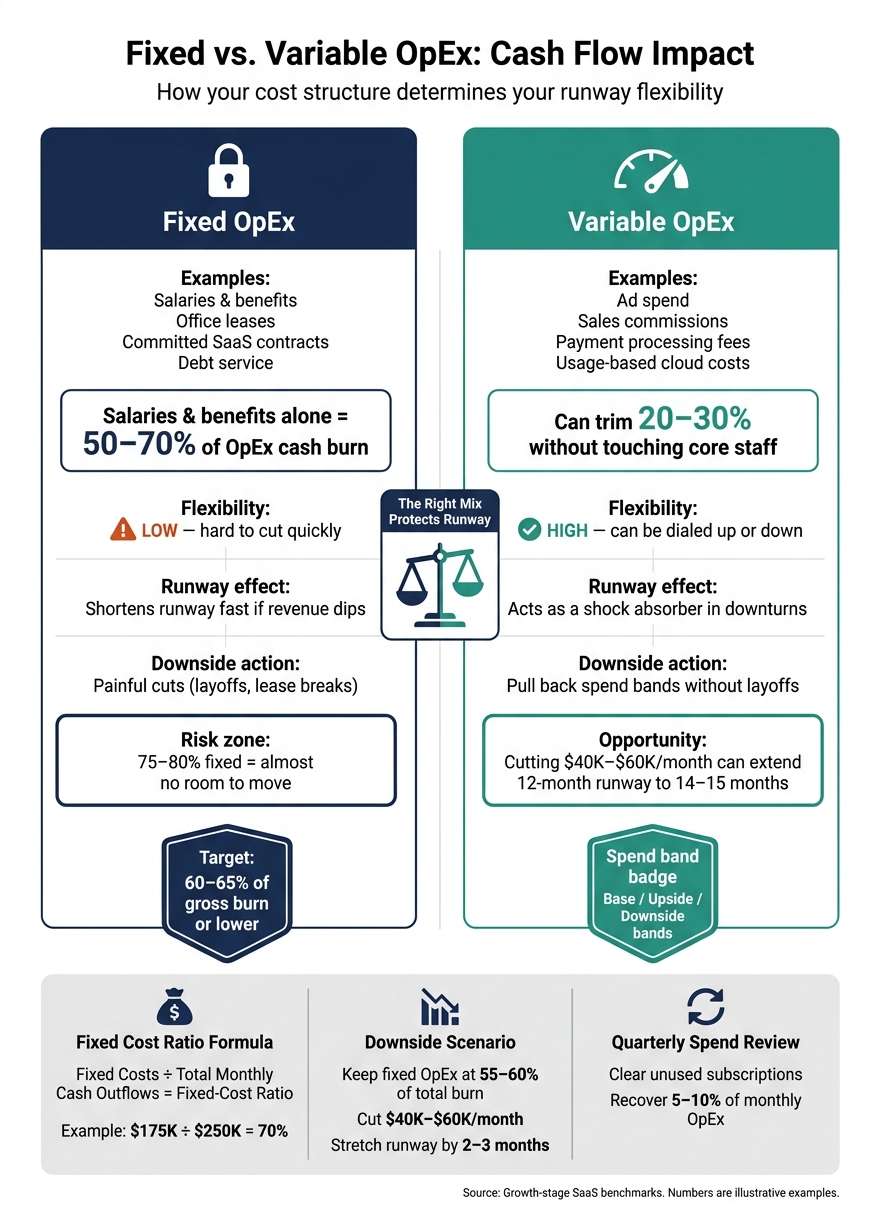
Fixed vs. Variable OpEx: Cash Flow Impact for Growth-Stage Companies
If you want to close cash gaps, OpEx needs to bend faster than collections do.
Start with the last 3–6 months of bank and card transactions, not just the P&L. That matters because the P&L can hide what cash is doing in the real world. Tag each recurring cost as fixed, add it up, and you’ll have your burn floor.
Here’s the simple math:
Fixed-cost ratio = fixed costs ÷ total monthly cash outflows
So if gross burn is $250,000/month and fixed costs are $175,000, fixed costs make up 70% of gross burn. Many growth-stage SaaS companies find that salaries and benefits alone eat up 50–70% of OpEx cash burn. A good target is to keep fixed costs at 60–65% of gross burn or lower.[1]
Contract length matters too. A 3–6 month software retainer or marketing contract gives you a built-in moment to cut, pause, or renegotiate based on actual results and your cash position. A 12–24 month deal doesn’t give you that room.
It also helps to run a quarterly spend review led by finance. Many companies use fractional CFO services to manage these reviews and optimize burn. Look for:
A lot of startups get back 5–10% of monthly OpEx just by clearing out recurring charges no one is using.[1]
Every dollar you take out of fixed burn extends runway right away.
Once you know the burn floor, the next move is to push more spend into areas that can flex with cash.
Variable spend should track cash collected, not just revenue booked.
Tie each budget line to a clear operating driver, like new customers, active users, closed ARR, or qualified leads. For marketing, a common rule is to cap spend at 10–20% of monthly recurring revenue and set a CAC ceiling. In B2B SaaS, acquisition spend is often capped at about one-third of customer lifetime value. If CAC moves above that line, spend should step down on its own.
The same logic works across the business. Cloud costs can move with user or transaction volume through autoscaling alerts. Commissions can be tied straight to closed revenue so those payouts rise only when cash is actually collected.[16]
It also helps to use three spend bands:
In a downside case, that might mean pulling marketing back to 8–10% of revenue and pausing noncritical experiments. The key is to set the trigger rules ahead of time so cuts happen fast when revenue misses or DSO starts climbing.[15][17]
Each one of these rules puts a guardrail around future cash gaps.
The point isn’t just to spend less. It’s to cut cash risk. This side-by-side view makes the tradeoff clear:
| Dimension | Fixed OpEx | Variable OpEx |
|---|---|---|
| Flexibility | Low - hard to cut quickly | High - can be dialed up or down |
| Effect on runway | Shortens runway fast if revenue dips | Acts as a shock absorber in downturns |
| Downside action | Painful cuts like layoffs or lease breaks may be required | Can trim 20–30% without touching core staff |
A company with 75–80% of burn locked into fixed costs has almost no room to move if revenue misses. But a company that keeps fixed OpEx at 55–60% of total burn and sets up the rest as variable can cut $40,000–$60,000/month in a downturn without going straight to core staff cuts. That can stretch a 12-month runway to 14–15 months with faster, less disruptive moves.[15]
Once you reshape OpEx, the next step is simple: measure what those changes do to cash. Fixed and variable spend may look fine on paper, but the real test is how they affect burn, runway, and short-term cash gaps.
Three formulas carry most of the load:
For cash you can actually use, stick to money that is available now. Leave out restricted cash, uncollected receivables, and undrawn credit lines. For runway, use a 3-month trailing average of net burn so one-off swings don't distort the picture.
That said, a monthly snapshot still misses one big thing: timing. Cash flow problems often come from when money moves, not just how much moves.
Map every inflow and outflow to a specific date. On the inflow side, log customer payments by expected deposit date, with ACH timing factored in, which is typically 3 business days, or card settlements, which usually land in 1–2 days. On the outflow side, include biweekly or semimonthly payroll, rent due on the 1st, software and cloud charges, tax remittances, and vendor invoices tied to Net 15 or Net 30 terms.[21][22][23][24]
This is where many teams get tripped up. A company can look solvent at month-end and still go negative in the middle of the month if payroll and vendor bills hit before receivables clear.[18][20][23][25]
A weekly cash calendar helps you catch that problem before it turns into a scramble. When cash is tight, review it every week. Done well, it can show a shortfall 4–8 weeks before it hits, which gives you time to pull collections forward, delay discretionary spend, or renegotiate a payment date.[22][24][25][26]
Use the table below to turn those formulas into a live spreadsheet model.
| Metric | Required Inputs | What Changes It Most |
|---|---|---|
| Gross burn | Monthly fixed costs ($), variable spend by category, one-time items flagged separately | Adding headcount, signing long-term leases, or large annual prepayments |
| Net burn | Gross burn and cash collected during the month, based on actual bank receipts rather than invoiced revenue | Customer payment behavior and collection delays |
| Runway (months) | Spendable cash on hand ($), 3-month trailing average net burn | Changes in fixed cost base, customer payment timing, or DSO |
| Cash gap (mid-month) | Daily or weekly outflow schedule, expected inflow dates by customer or segment, opening balance | Payroll timing, rent due dates, vendor Net terms, and average collection delay |
Make every input editable so runway and cash gap update on their own when assumptions change.[19][25][28]
Once the model is built, the hard part starts: keeping it up to date every single week.
A simple weekly cash review helps. Reconcile bank balances, sort major cash transactions, update the 13-week forecast, and roll it forward by one week. Then swap forecast assumptions with actual results and send the CEO a short cash note with three things:
That quick update keeps cash front and center without turning the process into a huge reporting exercise.
On a monthly basis, close the books and recast gross burn, net burn, and runway using actual cash movements. This matters because cash plans can drift fast when the numbers in the model stop matching what’s happening in the bank account.
When that weekly rhythm starts slipping, delegated finance support is usually the next move.
If a team can’t keep this cadence going in-house, outside support can help keep it on track. Phoenix Strategy Group works with growth-stage companies to put the right systems in place so cash control becomes repeatable. That includes bookkeeping, fractional CFO services, FP&A, and data engineering.
Their fractional CFO service covers cash flow forecasting, scenario planning, and board-ready reporting without the cost of a full-time hire. The goal is simple: move cash management out of ad hoc spreadsheet work and into a repeatable management system for companies dealing with tight liquidity during fast growth.
Keep fixed costs lean. Tie variable spend to performance. Stay tight on payment terms.
And use a weekly 13-week cash calendar to spot problems early. OpEx improves cash flow when timing, flexibility, and payment terms are managed together.
Profit and cash flow don't always move together. Profit is an accounting number. Cash flow is about when money actually lands in your bank account.
That gap matters more than many people think.
A business can look profitable on paper while still feeling short on cash. Why? Because booked revenue isn't the same as collected money. You may have sent the invoice, recorded the sale, and shown a profit, but the cash still hasn't arrived.
The squeeze usually comes down to timing. Costs like payroll, software, and marketing often need to be paid right away, while customer payments may not show up for 30 to 90 days.
Payment terms shape runway because they change the timing of cash in and cash out. And timing matters just as much as revenue on paper.
Shorter customer terms, like Net 15 or Net 30, help you collect cash sooner. That usually lowers DSO, frees up working capital, and gives you more room to operate. In plain English: money lands in your account faster, so your runway lasts longer.
Longer customer terms, like Net 60 or Net 90, do the opposite. They push cash inflows further out and can leave you stuck in a bigger cash gap. That gap gets worse when you pay suppliers before customers pay you.
A simple model can make this easier to see. Track DSO and DPO month by month to forecast cash shortfalls and estimate how much runway you have left.
A 13-week cash forecast gives you a week-by-week view of liquidity, so you can catch cash shortfalls before they turn into a problem.
Include your opening cash balance, ending cash balance, and every major cash movement in between. That means cash coming in from customer collections based on the expected receipt date, and cash going out for payroll on the actual pay date, vendor payments, rent, taxes, debt service, and uneven items like capital expenditures, marketing investments, and inventory commitments.
For the first six weeks, build the forecast from the ground up using actual aging, scheduled payables, and confirmed payroll. This part should be tied closely to what’s already on the calendar and what your team knows is due.
For weeks 7–13, switch to top-down estimates linked to your revenue plan. At that point, the forecast becomes more about direction than precision, but it still helps you see what’s coming and where pressure may build.