Published on
August 24, 2026


If your cash feels tight, inventory is often the first place to look. For many U.S. CPG brands, a 60- to 90-day cash conversion cycle can tie up about $740,000 on $3,000,000 in revenue.
Here’s the short version: I’d focus on the seven moves that cut cash stuck in stock and improve payment timing:
This matters because DIO is often the biggest cash lever for growth-stage brands. Even small changes can free up cash fast: a 15% cut in a $500,000 inventory position can release about $75,000, and moving DIO from 75 days to 58 days can free up $1.8 million in the right setup.
A fast way to think about the list:
| Tip | Main cash problem it targets | Main metric |
|---|---|---|
| SKU rationalization | Too many slow movers | DIO |
| Smarter order timing | Ordering too early | DIO |
| Tiered safety stock | Excess buffer stock | DIO |
| Supplier terms | Paying vendors too soon | DPO |
| Demand-driven planning | Weak forecast signals | DIO |
| Markdown management | Margin loss from aging stock | DIO, margin |
| Shorter PO horizons | Inventory build-up between orders | DIO, turns |
Bottom line: I’d treat inventory as a cash system, not just a supply issue. When you tighten SKUs, buys, buffers, terms, and markdown rules together, you can free cash without new funding.
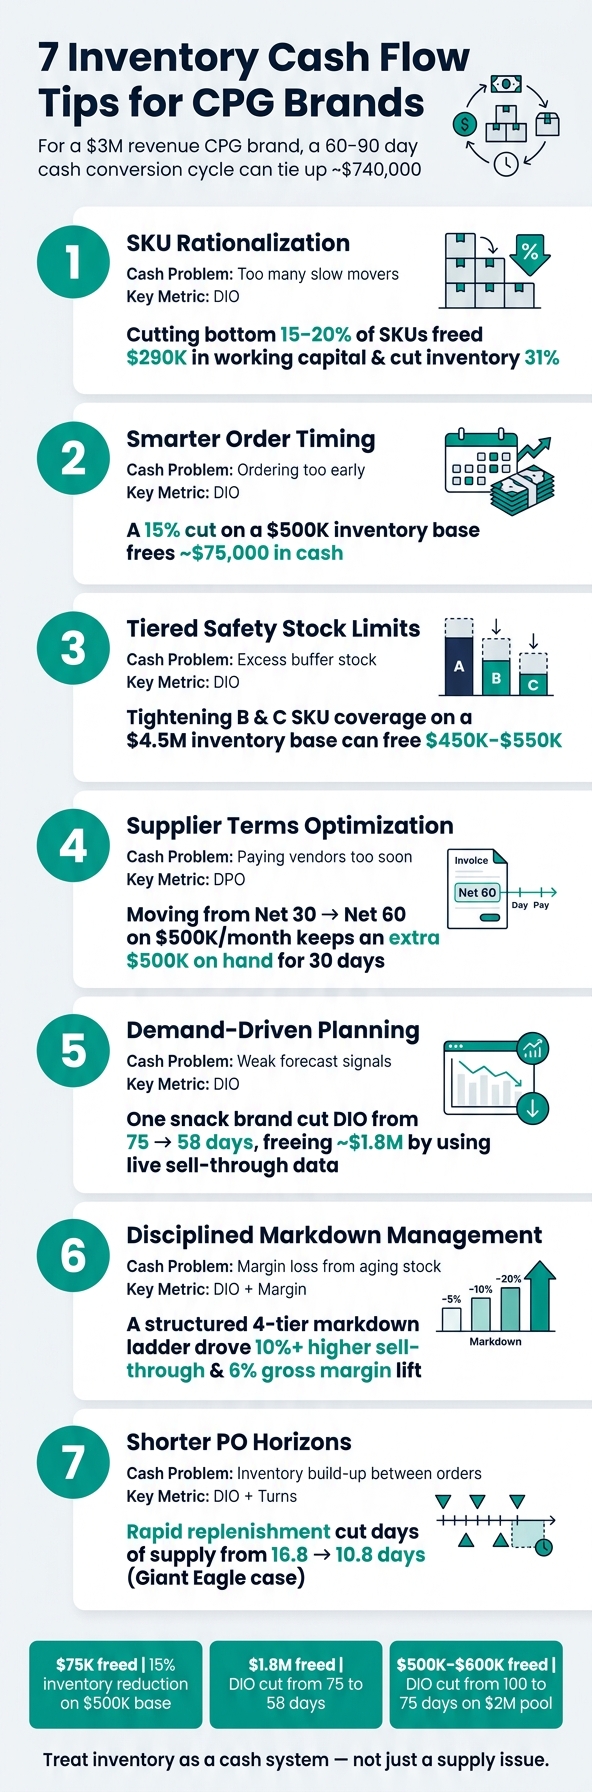
7 Inventory Cash Flow Tips for CPG Brands: Key Metrics & Cash Impact

SKU rationalization cuts cash tied up in slow inventory, repeat orders, and changeovers. In many CPG portfolios, the bottom 15%–20% of SKUs soak up cash without adding much margin. That's the long tail problem: too many low-value items sitting on the books. The result is higher DIO and slower cash recovery than most teams realize.
In one case, discontinuing low-turn SKUs freed $290,000 in working capital and cut inventory 31% while revenue grew 14%.[3]
To spot cut candidates, look at each SKU at the item level across sales velocity, margin, DIO, and forecast accuracy. A simple screen helps:
That gives you a cleaner way to separate cash-draining SKUs from items that still earn their shelf space.
Before cutting anything, protect SKUs that matter to key retailers or channels. If an item plays a needed role in a major account, don't pull it without a plan. For most weak performers, customers move to core items when retailers get a clear substitute planogram. The phaseout should run over 6–12 weeks: stop new POs, sell through stock with planned markdowns, and watch fill rates closely. The point is to lower DIO without sneaking excess stock back into the system.
It also helps to frame each cut in plain dollar terms. Sales teams tend to engage more when they can see the cash tied up by a low-priority SKU. Bring them in early, then assign owners, milestones, and KPIs tied to DIO, inventory dollars freed, and margin. Once the assortment gets leaner, the next cash lever is order timing.
Once the assortment is lean, the next move is to tighten when you reorder. A lot of CPG brands still place orders on a fixed monthly or quarterly rhythm. That's simple, but it can also leave too much cash sitting on the shelf.
A better approach is to time POs based on sell-through. The aim is straightforward: inventory should land closer to when it will actually sell. That brings down DIO. And the cash impact can be hard to ignore. Cutting on-hand inventory by 15% on a $500,000 base frees about $75,000 in cash.[1][4]
To do that well, look at:
Monthly averages often smooth over demand swings that matter. They can make a fast change look small until it's too late. Retailer POS data, distributor depletion reports, and DTC sales give you a much sharper read on what's happening now. One detail matters here: separate retailer DC inventory from store inventory. If you lump them together, you'll likely over-order before there's a true replenishment need.
Of course, tighter timing can increase stockout risk. But this isn't guesswork if you set it up the right way. Build reorder points from lead-time demand, then add a small safety stock buffer. After that, track fill rates closely. Start with SKUs that have steady demand and short lead times. They're usually the easiest place to tighten timing without much drama.
Other SKUs need a slower hand. Highly seasonal items, new launches, and long-lead imported goods call for more conservative timing until demand visibility improves.
There's also a supplier angle. Renegotiate minimum order quantities (MOQs) where you can. Smaller releases, even if they come with a small release fee, can cut average inventory and keep cash from piling up in stock. It also helps to run weekly or biweekly reviews so sales, ops, finance, and procurement can line up before a PO goes out.
Once order timing is tighter, the next lever is capping safety stock by SKU.
Flat safety stock rules tie up cash fast. The problem is simple: slow-moving SKUs sit with too much backup stock, while fast-moving items can still run out.
A tiered setup fixes that by giving each SKU a buffer based on its value and sales speed. With ABC tiers, A SKUs get the highest service levels, B SKUs get mid-level coverage, and C SKUs get the lightest coverage, sometimes little to none. That can cut DIO while protecting service on the SKUs that matter most.[7][9][10][6][11][12]
Here’s what that can look like in practice. A brand holding $4,500,000 in finished goods across 300 SKUs under a flat 40-day policy could free up $450,000–$550,000 just by tightening B and C coverage. If C SKU coverage drops from 35 days to 15–20 days, that alone could release $250,000–$300,000. Trim B SKUs by about 10 days, and that could unlock another $200,000–$250,000. A SKUs stay untouched.[7][11][12]
The timing matters too. Most brands start seeing cash come back within one to three inventory turns. In many cases, the rollout takes 8–12 weeks:
The main risk is a sudden spike in C-SKU demand. The fix is to set reorder points using lead-time demand and demand variability, then review the tiers every quarter.
Once you’ve tiered the buffers, supplier terms become the next place to look for cash.
After safety stock, payables are the next big cash lever. Longer payment terms let cash stay in the business longer. That gives you more time to sell inventory before you pay the supplier. In plain English: extending payment terms improves your cash conversion cycle by increasing Days Payable Outstanding (DPO).
Here’s a simple example. If you move from net 30 to net 60 on a $500,000 monthly purchase, you keep an extra $500,000 on hand for 30 more days.[13][20]
But there’s a catch: early-pay discounts can change the math. A common setup is 2/10 net 30, which means you pay within 10 days and get a 2% discount. That 2% over 20 days works out to an annual return of about 36.5%. On a $500,000 monthly spend, that’s $10,000 saved per month, or $120,000 per year.[15][17][18]
So which option makes more sense? It comes down to liquidity. If cash is tight, longer terms usually help more. If your brand has cash available and inventory moves fast, taking the discount can be the better play.
Of course, pushing for better terms isn’t risk-free. Suppliers may tighten credit limits, ask for deposits, or push your orders back during peak periods. That can increase stockout risk. A safer move is to focus on larger suppliers where your order volume gives you some leverage. You can also trade longer terms for things like:
Once new terms are in place, the next job is making sure they stick. Put the agreed terms into ERP and AP workflows. Set a clear target, such as moving 50% of COGS suppliers to net 60, then have a cross-functional group track progress each month. A DPO-by-supplier dashboard, paired with your overall CCC, makes it much easier to see what’s changing and where deals are slipping.
You’ll also need to update ERP terms, adjust AP schedules, and retrain procurement and AP teams on the new payment rules. The goal is simple: build the rules into AP workflows so payment timing follows policy, not discretion.[14][16][19]
Once you've tiered safety stock, the next move is to plan from live demand instead of old averages. A lot of CPG brands still rely on monthly or quarterly averages that are already out of date by the time someone acts on them. The result is pretty predictable: slow movers get overbuilt, while fast sellers run short.
The fix is to use live sell-through signals - retailer POS, EDI orders, Amazon Vendor Central, and DTC data - and update plans weekly or even daily. In plain English, you're pulling from what's selling now, not what sold weeks ago. When teams apply this to their highest-volume SKUs, DIO can drop fast.
One snack brand with $8 million in inventory cut DIO from 75 to 58 days by moving top SKUs to weekly production and blocking promo builds without committed retailer orders. That change freed about $1.8 million.[21][22]
A simple way to think about it:
The hard part isn't the idea. It's getting POS, distributor, and e-commerce signals into one weekly plan without turning the process into a mess.
Once demand gets clearer, the next cash leak is excess stock that has to be discounted.
Ad-hoc discounting is one of the biggest quiet cash leaks in CPG. A slow-moving SKU can sit for weeks, the team reacts too late, and then the item gets hit with a 50% discount. Margin disappears in one move.
A better approach is simple: set clear markdown triggers and follow them. Use a tiered markdown ladder tied to inventory health. If projected DIO is running 20% to 30% above target, start with a modest 5% to 10% discount to help move units. If inventory still trails on the next review cycle, step up to 15% to 25%. Save 30% to 40% clearance for old or seasonal stock, and push that inventory into secondary channels like outlet partners or club packs. Before any markdown goes live, require approval from finance or revenue management.
The numbers show why early action matters. A 20% to 25% early markdown usually beats a 50% late panic cut on both sell-through and total profit.[23][24] In one markdown optimization project, the team moved from two discount levels, 30% and 50%, to four levels: 20%, 30%, 40%, and 50%. The result was more than 10% higher clearance sell-through and a 6% lift in gross margin.[25] That’s a strong payoff from a more controlled discount ladder.
Cash flow improves too. Cutting DIO from 100 days to 75 days on a $2,000,000 inventory pool frees about $500,000 to $600,000 in working capital. And inventory isn’t cheap to hold. Carrying costs often run 15% to 20% per year once you include storage, obsolescence, and the cost of money tied up in stock. Smaller markdowns made earlier bring cash back faster and protect more gross margin than waiting until the situation turns into a fire drill.
Markdowns also need to line up with replenishment. If a Tier 2 markdown is expected to lift weekly unit sales by 20%, update open POs before the discount starts. The same demand signals used for replenishment should also guide the markdown plan. Once markdowns are under control, the next cash lever is shorter PO horizons.
Once markdowns move excess stock, the next step is simple: shorten the replenishment cycle so inventory doesn’t pile up again. Shorter PO horizons lower average inventory and free up cash faster.
At Giant Eagle, a rapid-replenishment program cut days of supply from 16.8 days to 10.8 days by moving from forecast-based ordering to order-based rapid replenishment.[28] That kind of shift can hit the balance sheet fast, sometimes within just one or two ordering cycles.
There is a trade-off. More frequent orders usually mean more admin work and slightly higher unit costs. But for most CPG brands, the cash freed up from carrying less inventory is worth more than that extra cost. A good rule of thumb: use the same demand signal to decide the next PO date.
Start with A-class SKUs. These are your high-velocity items with steady demand and suppliers you can count on. They’re the best place to test a shorter ordering rhythm. On the other hand, volatile SKUs, long-lead imports, and seasonal products usually need more coverage.
A few moves make this easier:
The cash effect becomes much easier to see in the tables below.
These tables boil the seven tips down into fast checks for where inventory is soaking up cash. Start with SKUs, move to safety stock, then look at markdowns.
Rank SKUs by sales velocity, gross margin, and inventory days. In many cases, C-tier items are the ones sitting on the most cash.
For many U.S. brands, aggressive but realistic inventory-day targets are 25–45 days for food & beverage and 45–70 days for beauty.[34][2][35]
| SKU Tier | Sales Velocity | Gross Margin | Inventory Days | Suggested Stocking Strategy |
|---|---|---|---|---|
| A | High | High | 25–45 days (food & beverage); 45–70 days (beauty) | Maintain high service levels; tighten replenishment cycle |
| B | Moderate | Medium | Near category median | Apply stricter reorder rules; review quarterly |
| C | Low (slow movers) | Low or variable | 120+ days | Reduce buy quantities; consider seasonal-only or exit |
Treat the strategy column as the next move. A C-tier SKU doesn’t always need to disappear. Sometimes a smaller minimum order quantity, or buying just once per season, is enough to free up meaningful cash.
Tiered safety stock trims cash waste by matching buffers to demand and lead time. Put simply, not every SKU needs the same cushion.
| Approach | Inventory Investment | Stockout Risk | Working-Capital Effect |
|---|---|---|---|
| Blanket safety stock | High (uniform buffer across all SKUs) | Not tailored to demand variability | More cash tied up; poor allocation |
| Tiered safety stock | Optimized per SKU class | Managed risk on high-priority SKUs | Lower inventory on B/C items; service protected on A-items |
The working-capital gap here isn’t small. One global CPG company cut inventory by $11 million after switching to a tiered safety stock model, without reducing service levels.[8][36]
Once inventory starts aging, speed matters. If you set markdown triggers early, smaller price cuts can stop a much bigger margin hit later.
Brands that plan markdowns at the buying stage achieve 10–20% higher full-price sell-through than brands that rely on reactive markdowns.[33] A structured markdown ladder - for example, 10% first, then 25% if sell-through lags - gets cash back sooner and helps protect margin.
| Approach | Cash Recovery Speed | Margin Erosion | Brand Implications |
|---|---|---|---|
| Ad-hoc discounting | Slower (delays let inventory age further) | High (deeper cuts required late in cycle) | Risk of training customers to wait for sales; weakens pricing power |
| Structured markdown | Faster (trigger points set early) | Lower (smaller discounts at earlier stages) | Controlled; preserves premium positioning when used selectively |
Liquidation often recovers 50% or less of inventory cost.[32] That’s a tough hit. A pre-planned markdown schedule will usually beat that outcome, especially when paired with the SKU rationalization and tiered safety stock choices shown above.
Shorter PO horizons only work when the rest of the inventory system lines up. All seven tactics cut cash tied up in stock, and the effects stack on each other. Leaner SKUs make safety stock easier to control. Tiered buffers make shorter PO cycles more workable. Better supplier terms give demand planning more room to do its job. That’s why this is a system, not just a checklist.
The next step is simple: track these levers on a set cadence. Review DIO, inventory turns, CCC, slow-mover exposure, and payable terms every month or quarter. Rising DIO is the early warning sign. If a SKU family goes past its target days on hand, tighten buys, reset safety stock, or mark down sooner. Total inventory dollars can mask aging stock, so review aged inventory by bucket - 0–30, 31–60, 61–90, and 90+ days on hand - to catch problems early instead of scrambling later.
For brands that want these controls built into forecasting and reporting, Phoenix Strategy Group helps growth-stage CPG brands build cash forecasts, KPI dashboards, and fractional CFO oversight that turn inventory decisions into working-capital gains.
Start with inventory turnover and aging. Run a 30-day review of inventory turnover, DIO, and your inventory aging report to find slow-moving or near-obsolete SKUs, especially anything sitting at 90+ days or 180+ days.
Then make 1–2 moves that can free up cash this quarter. That could mean clearing slow-moving stock with targeted markdowns or bundles. Or it could mean pushing for better supplier terms on upcoming orders linked to your 13-week cash forecast.
Lower inventory without causing stockouts by replacing guesswork with data. Calculate safety stock and a reorder point so replenishment kicks in at the right time.
It also helps to use ABC analysis so you can watch high-value items more closely, track inventory in real time, and sharpen forecasts with at least 12 months of sales history, seasonal trends, and market signals.
Track these key metrics:



