Published on
August 31, 2026


If labor cost keeps taking a bigger share of revenue, your margin and cash runway get squeezed fast. As a fractional CFO, I look at this ratio to answer three simple questions: Can I hire? Do I need to reprice? How much room do I have before cash gets tight?
Here’s the short version:
| Business Model | Typical Labor Cost % of Revenue | What Usually Drives It |
|---|---|---|
| Professional services | 40%–60% | Utilization, rates, staff mix |
| Agencies | 50%–60% | Project mix, retainers, account overhead |
| Manufacturing | 10%–20% | Automation, materials, plant use |
| Healthcare / home care / clinics | 50%–70%+ | Staffing rules, payer mix, care needs |
| Logistics / warehousing | 20%–40% | Automation, contractors, asset mix |
| B2B SaaS | 50%–75% early; 50%–60% scaling | Product and sales hiring ahead of revenue |
My main takeaway: don’t treat this like a fixed target. I’d track the trend, compare it against the right peer group, and read it next to utilization, gross margin, revenue per FTE, and cash burn before making a hiring or pricing move.
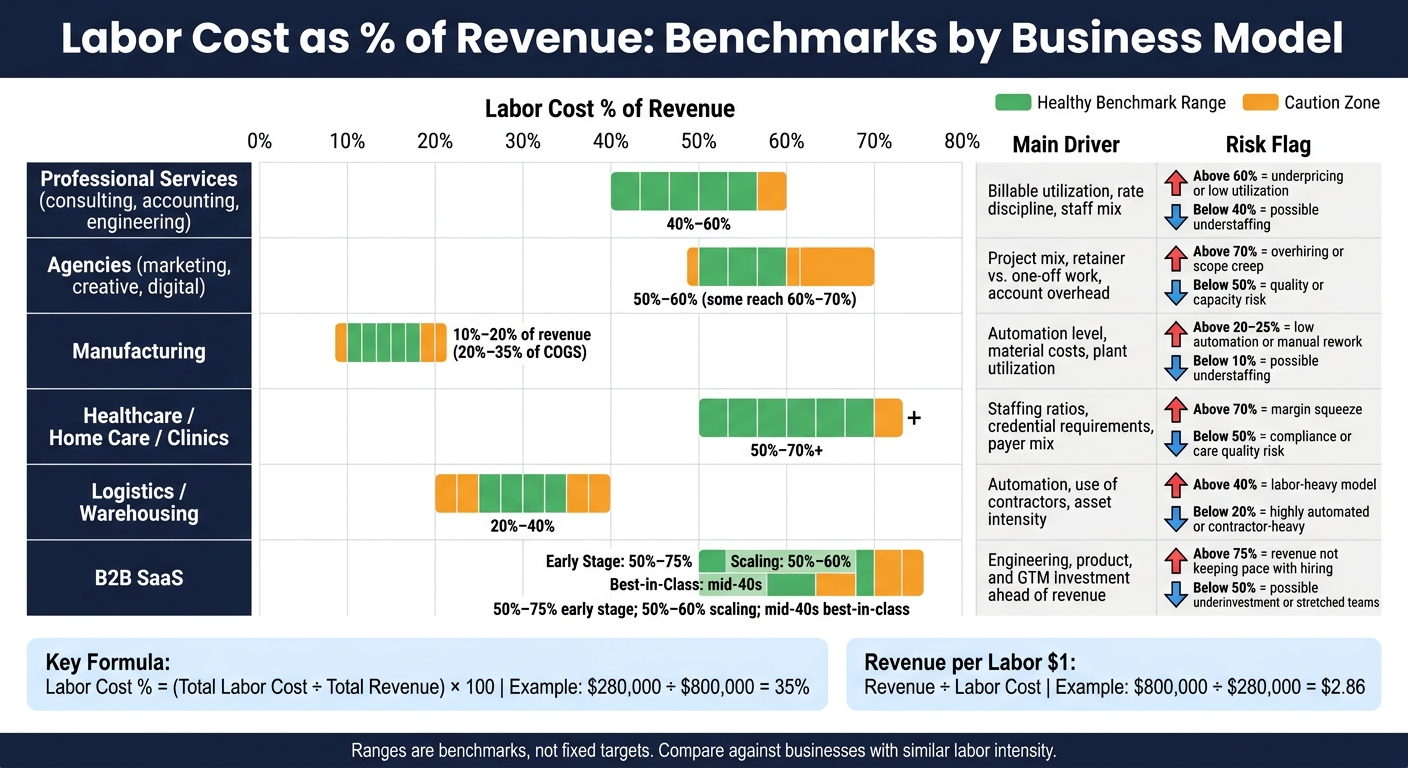
Labor Cost as % of Revenue: Benchmarks by Business Model
Once you can calculate the ratio, the next step is context: what level is normal for your model? Fractional CFO services can help you establish these benchmarks.
Labor cost ratios change by business model. So the right benchmark is companies that look like yours, not one universal target. A healthy ratio depends on the model. Put simply, it’s healthy when revenue is keeping up with payroll.
The main reason these ranges vary comes down to one thing: how much of the product or service depends on people doing the work? In professional services, labor is the main input. In manufacturing, equipment and raw materials carry more of the load. That difference explains most of the gap between a professional-services ratio of around 40–60% and a manufacturing ratio of around 10–20%.
Treat these ranges as guideposts, not hard rules. The useful comparison is not between industries. It’s between businesses with the same level of labor intensity.
| Business Model | Typical Labor Cost % of Revenue | Main Drivers | Common Risk Flags |
|---|---|---|---|
| Professional services (consulting, accounting, engineering, architecture) | 40–60%[4][8] | Billable utilization, rate discipline, senior vs. junior staff mix | Above 60%: underpricing or low utilization; below 40%: possible understaffing or workloads that may not hold up |
| Agencies (marketing, creative, digital) | 50–60%, with some firms reaching 60–70%[8][10] | Project mix, retainer vs. one-off work, account management overhead | Above 70%: overhiring or scope creep; below 50%: quality or capacity risk |
| Manufacturing | 10–20% of revenue; 20–35% of COGS[3][5][9] | Automation level, material and energy costs, plant utilization | Above 20–25%: low automation or manual rework; below 10%: possible understaffing or future bottlenecks as demand rises |
| Healthcare / home care / clinics | 50–70%+[10] | Staffing ratios, credential requirements, payer mix, regulatory mandates | Above 70%: margin squeeze; below 50%: compliance or care quality risk |
| Logistics / warehousing | 20–40%[5][9][12] | Automation, use of contractors, asset intensity | Above 40%: labor-heavy model; below 20%: highly automated or contractor-heavy operation |
| B2B SaaS | 50–75% early stage; 50–60% during scaling; best-in-class in the mid-40s[2][6][7][11] | Engineering, product, and go-to-market investment ahead of revenue; economies of scale | Above 75%: revenue not keeping pace with hiring; below 50%: possible underinvestment or stretched teams |
A ratio above your peer range is worth a closer look before you call it a crisis. Most of the time, it means too much of each revenue dollar is going to labor, which leaves less room for other operating costs, investment, and profit. Common causes include underpricing against the market, low billable utilization, hiring ahead of demand, or manual work that never got fixed as the business grew.[4][8][10][12] For example, a consulting firm running above 60% when the benchmark is 40–60% is probably giving up margin through discounted fees or too many non-billable roles.
A ratio below your peer range isn’t always a win either. It can mean your team runs lean, your pricing is strong, or automation is doing its job. But it can also point to understaffing - turning away work, pushing too much onto current employees, or letting service quality slip.[4][8][10] In healthcare and agencies in particular, a lean-looking labor ratio can slowly wear down service quality and staff retention.
The main question is simple: does the ratio reflect a choice you made, or a problem you need to fix? Use these ranges to judge whether the ratio is getting better or getting worse over time.
Benchmark ranges only help if you calculate the ratio using clean numbers that line up.
Use the same labor and revenue definitions from the prior section, and line them up to the same month or quarter. For example, $85,000 in labor against $250,000 in revenue equals 34.0%, or $0.34 per $1.00 of revenue.[14][15] After that, the next step is simple: compare your result with the benchmark range for your business model.
Use monthly data for day-to-day operating decisions. Use quarterly data for board reporting and planning.
The most common mistake is using payroll-only figures instead of fully loaded labor cost. If your actual labor cost is $85,000 but you report only $70,000 in wages, your ratio falls from 34.0% to 28.0% - a big enough gap to make a strained model look fine.[16][17]
Another common issue is leaving out core contractors. Agencies, healthcare operators, and marketplace businesses that depend on 1099 workers often understate their labor burden. That can make it seem like there’s room to hire when there isn’t.
Mixing time periods can also wreck the number. Comparing annual payroll of $1,200,000 with one quarter’s revenue of $300,000 gives you a 400% ratio - a mathematically valid result, but not one you can use.[17][18] The fix is straightforward: match the numerator and denominator to the same month or quarter on an accrual basis.
Use the table below to turn the ratio into action:
| Ratio vs. Benchmark | Common Causes | Next Steps |
|---|---|---|
| Below benchmark | Understaffing; high automation; benefits or contractors excluded from labor cost | Confirm fully loaded labor is in the numerator; check staff workload; evaluate strategic hires |
| At benchmark | Balanced staffing and pricing; consistent labor definition | Maintain cadence; model headcount scenarios before acting |
| Above benchmark | Hiring ahead of revenue; wage inflation; discounting; period misalignment | Fix definition or period errors first; review pricing; sequence hiring until revenue catches up; model 12–18 months of runway |
Use the benchmark gap to decide what to do next: hire, reprice, or tighten cash control.
Before you approve a hire, model the fully loaded monthly cost. That means salary, payroll taxes, benefits, and tools. Then project the ratio 3 to 12 months out using a revenue ramp that’s grounded in reality, not best-case thinking.
It also helps to track revenue per FTE as a second check. If revenue per FTE drops after a round of hiring, that’s usually a sign the team grew faster than the business did.
For service businesses, one simple rule is to keep revenue supported by current labor at at least 3.5x fully loaded delivery labor cost. A range of 2.5x–3.5x is a warning zone, and below 2.5x is a danger zone.[19] If a planned hire pushes you into that danger zone - or cuts runway in a meaningful way - it’s smarter to wait, test the role with a contractor, or tie the hire to a revenue milestone first.
A ratio above your benchmark range means hiring should probably pause until revenue catches up. A ratio below range may leave room for selective hiring, but only if workload and capacity data support it.
If headcount looks about right, the next place to look is pricing and utilization.
When billable utilization is strong but labor cost as a share of revenue is still too high, the issue is usually pricing or scope.[21][1] And if revenue per FTE is flat or falling even though utilization stays high, that often points to underpricing or scope creep.
In that case, cutting headcount misses the point. The better lever is to reprice or repackage the work. That can mean:
After 2–3 billing cycles, check whether the ratio improved without hurting pipeline or retention.
If pricing doesn’t seem to be the issue, look at whether payroll growth is squeezing runway.
Every hire changes burn, so test the ratio against cash runway before you say yes. Payroll can make up 60%–75% of total burn at a startup,[24] so even a small increase in headcount can shorten runway more than people expect. The formula is simple: Runway = cash ÷ net monthly burn.[20]
The table below shows how three hiring paths affect labor cost as a share of revenue and runway, using a company with $2,000,000 in cash as the baseline.[22][23]
| Hiring Strategy | Expected Labor Cost % of Revenue (Next 12 Months) | Runway on $2,000,000 Cash | Main tradeoff |
|---|---|---|---|
| Aggressive Hiring | 60%–70% | ~10–12 months | Faster team build-out and capacity, but high risk if revenue ramp lags |
| Balanced Hiring | 45%–55% | ~14–18 months | Steady growth with room to adjust pricing or scope if needed |
| Efficiency-First Hiring | 30%–40% | ~20–24+ months | Strong margins and runway, but slower topline growth and possible capacity constraints |
After hiring, pricing, and runway decisions, the next step is simple: check whether the ratio is moving in the right direction. One month almost never gives you the whole picture. If the ratio is going up, labor costs are growing faster than revenue, or revenue growth is slowing compared with payroll. But you can't tell which one is driving the change by looking at the ratio alone. That's why it helps to track labor cost ratio next to utilization, gross margin, and cash flow. When those numbers move in the same direction, you get a clearer read on whether the business is gaining margin or losing it. When they split apart, pause and look closer before making a hiring or pricing call.[25][26]
The discipline here is pretty straightforward: use the same definitions every time, compare against the right business model, and judge the ratio by its direction of travel instead of treating it like a fixed target.[13][27][28]
That only works if the underlying data is solid. For growth-stage companies, clean bookkeeping, steady revenue recognition, and FP&A models that tie hiring plans to runway forecasts make this ratio useful enough to guide hiring and runway decisions. Phoenix Strategy Group helps growth-stage founders build those systems.
Use gross revenue only when the formula directly compares labor output to total sales, like Sales per Employee.
For a labor-efficiency ratio, use gross profit divided by total labor costs. That connects payroll spend to the gross profit the team helps produce.
If you're calculating labor cost as a percentage of revenue, use the revenue definition that benchmark calls for. In most cases, that's total revenue.
Track your labor efficiency ratio often enough to spot issues early, but not so often that it turns into noise.
A simple rhythm works well:
A hiring freeze can make sense when your labor efficiency ratio (LER) falls below 2.0.
That usually means labor costs are drifting out of line with profit. At that point, it’s smart to pause hiring and figure out what’s going wrong. The cause could be overtime spikes, delays, or productivity issues.
If your employee expense ratio is climbing toward overstaffing territory too, that’s another clear sign to stop adding headcount.



