Published on
September 5, 2026


Use unlevered beta to compare business risk. Use levered beta to price equity at your target debt load. That is the short answer.
If I mix them up, my discount rate can shift fast. And when I’m valuing a growth-stage company, even a small beta change can move the result by a lot.
Here’s the simple version:
A simple CAPM input can have a big effect on value. If β goes from 1.00 to 1.30, and the equity risk premium is 5.5%, the cost of equity moves by about 1.65 percentage points. In a DCF, that can cut present value by a lot.
| Topic | Unlevered Beta | Levered Beta |
|---|---|---|
| What it shows | Business risk only | Equity risk after debt |
| Best use | Peer comparison, industry baseline | Cost of equity, WACC, DCF |
| Debt included? | No | Yes |
| Best for private firms? | Yes, as a peer-based starting point | Yes, after releverage |
| Main risk of misuse | Ignoring company stage and peer fit | Ignoring capital structure differences |
If I’m working on a growth-stage valuation, I start with peer business risk first. Then I add the company’s target leverage. That keeps the beta tied to how the business works and how it will be financed.
Levered beta, also called equity beta, is the beta of a publicly traded stock. It reflects a company's business risk plus the effect of its current debt load, which matters even more when debt levels are moving fast.[6][5][1]
Put simply, levered beta includes debt. Unlevered beta removes debt so you can look at operating risk on its own.
In day-to-day finance work, this matters a lot. Debt makes equity returns more sensitive to shifts in operating performance. So two companies in the same industry can look similar on the surface, yet still end up with very different levered betas if one carries more debt than the other.
The standard formula connects levered beta and unlevered beta like this:[7][9][10][2]
β_L = β_U × [1 + (1 − T) × D/E]
Here, β_U is unlevered beta, which reflects business risk only. T is the corporate tax rate. D/E is the debt-to-equity ratio. The (1 − T) part reflects the tax shield on debt. Because interest is tax-deductible in the U.S., taxes partly offset the added risk that comes with leverage.[7][9][15] That's why capital structure plays such a big role when you're comparing peers.
For example, if a company has an unlevered beta of 1.0, a D/E ratio of 0.5, and a 21% tax rate, its levered beta is 1.395.[16]
For growth-stage companies, levered beta tends to move up with:
These drivers help explain why equity risk can swing so much from one company to another, even inside the same market segment.[12][14][2]
Use levered beta when you need the cost of equity for a specific capital structure. That comes up in DCF and WACC models, fundraising fairness checks, and scenario work around financing events like adding venture debt or finishing a recapitalization.[8][10][11][3]
For private or thinly traded growth-stage companies, finance teams often borrow betas from comparable public companies, then adjust them in two steps. First, they unlever those betas to isolate business risk. Then they relever the result using the company's target D/E ratio.[10][3][14][2] That way, the valuation stays tied to the risk equity investors are actually taking.
Higher leverage can push up levered beta and the cost of equity fast. That's why analysts often move to unlevered beta next when they want a capital-structure-neutral view.
If levered beta shows equity risk after debt, unlevered beta removes debt to show operating risk. It's also called asset beta. Put simply, it measures business risk before financing enters the picture.
The idea is simple: assume an all-equity capital structure and isolate operating risk. That means looking at how sensitive a company's cash flows are to broad market moves, without mixing in the effects of debt.
Use levered beta for equity risk. Use unlevered beta when you want to compare operating risk across firms.
The standard formula for removing debt effects from an observed equity beta is:
β_U = β_L / [1 + (1 − T) × D/E]
In practice, you unlever each peer's beta using that peer's own debt-to-equity ratio and tax rate. Then you take the median to get the industry beta.
Why not just average the levered betas first and unlever once at the end? Because that can skew the result toward the firms carrying the most debt.
The point here is to compare business risk, not capital structure. That's why peer betas need to be unlevered before you combine them.
Private and thinly traded companies often produce noisy regression betas because there isn't much trading data to work with. An unlevered industry beta helps cut through that noise.
Instead of leaning on thin market data, it uses a broader set of more liquid, mature peers. That ties the risk estimate to the economics of the business model rather than short-term trading quirks.
Once the team has that industry beta, it can re-lever the figure using the company's target debt-to-equity ratio. That gives you a firm-specific levered beta for CAPM and WACC calculations.
That operating-risk baseline is what makes sector comparisons meaningful. And it matters because industry structure changes how beta should be read.
Using one sector beta from a published table is a common shortcut. But for growth-stage companies, it can easily understate or overstate risk. Broad sector tables often mix businesses that look similar on paper but run in very different ways, so the beta may reflect a mature incumbent instead of the company you're trying to value. [22][23][24] After beta is unlevered, the next step is figuring out which industry traits explain the spread.
A bottom-up beta is usually a better place to start. The idea is simple: use 10–20 public peers that look like the target company in terms of revenue model, margin profile, growth rate, and customer base. Then unlever each peer, take the median, and relever that figure to the target capital structure. [22][23][24]
Within a single sector, beta can still vary a lot. Customer concentration, fixed-cost intensity, cyclicality, and growth expectations all help explain why. Those factors can push unlevered beta above or below the sector median. [23][24]
You can see those gaps most clearly when you compare business models.
SaaS and recurring-revenue software often post moderately high unlevered betas because they carry fixed R&D, sales, and marketing costs. NYU Stern's U.S. sector data shows Internet software with levered betas of about 1.55–1.69 and unlevered betas of about 1.30–1.55. High-retention, enterprise-focused SaaS with multi-year contracts tends to land near the lower end of that range. Usage-based models with higher churn and concentrated customers often land near the upper end. [19]
Professional services firms like consulting, agencies, and IT services usually have lower unlevered betas because more of their cost base can move with demand. If business slows, they can cut billable headcount or other variable expenses faster than a business with heavy operating leverage. NYU Stern data for Industrial Services shows unlevered betas of about 0.79–0.82. [18][21]
Asset-heavy manufacturers can carry high business risk even before debt enters the picture. Fixed plants, machinery, and logistics create strong operating leverage, and cyclical demand can make that effect hit harder. Sector studies on U.S. manufacturing show unlevered betas of 1.70 for pharmaceutical and medicine manufacturing and 1.24 for motor vehicle body and trailer manufacturing. [20]
Even when two companies share the same sector label and sell similar products, a growth-stage firm can be riskier in structural ways than a mature public incumbent. Fast expansion makes a revenue miss hurt more. Margins may still be unproven. Customer acquisition costs are often front-loaded. And the company may depend more on capital markets than a cash-rich public peer. Those factors can support a higher beta assumption when the company's volatility and funding dependence sit clearly above the peer set. [23][24]
Fractional CFOs and finance teams can support that adjustment by tracking a few operating signals:
If those metrics are materially worse than the selected public peers, beta should move up instead of being copied from a sector table. That keeps the estimate tied to the company's actual operating risk, not the median for mature peers. [23][24]
A practical way to handle this is to build two peer sets: one based on mature incumbents and another based on high-growth public peers with similar unit economics. Compare the unlevered betas from both groups, then pick a value within that range based on the company's actual growth profile and execution risk. [23] Use those gaps to choose the beta input that best fits the company's operating risk and capital structure.
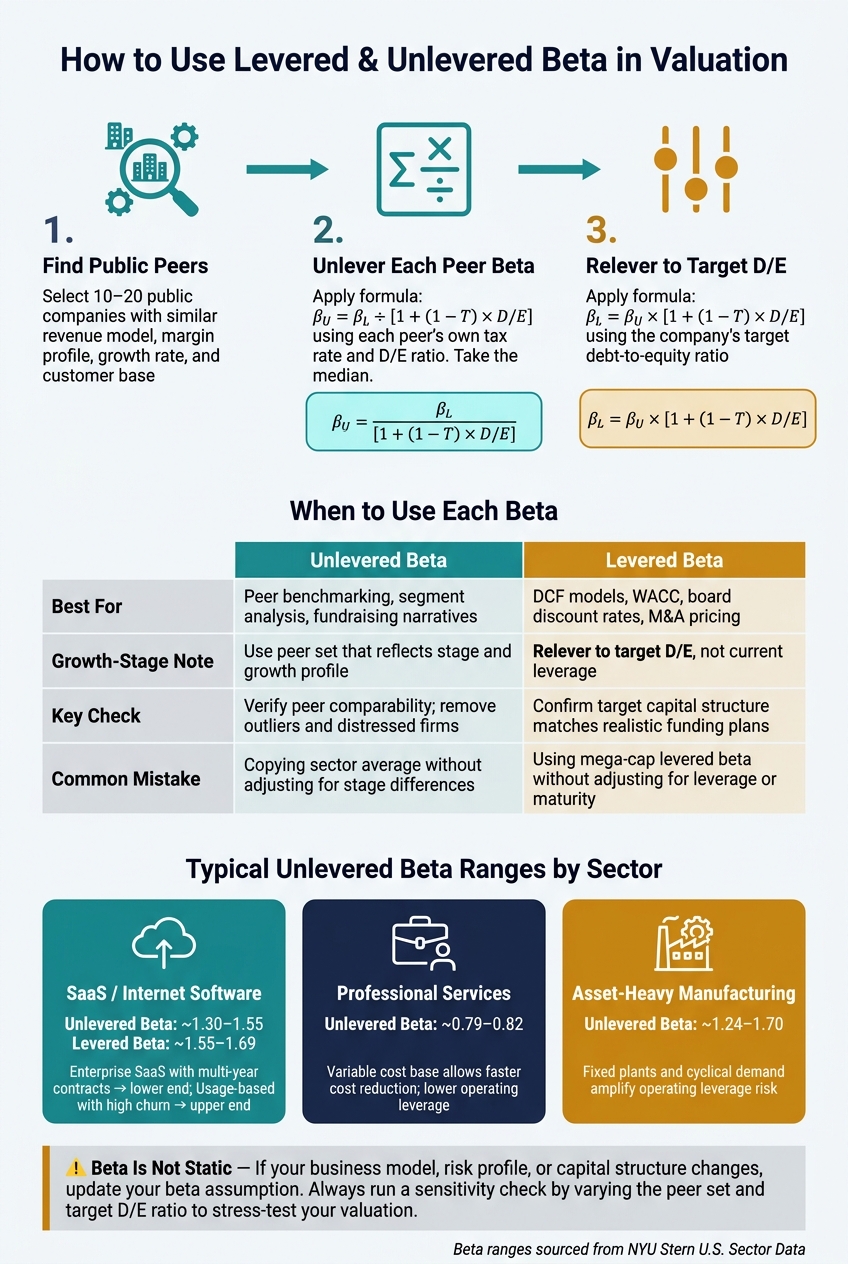
Levered vs Unlevered Beta: 3-Step Valuation Workflow for Growth-Stage Companies
Once you have an industry beta, the next step is to turn it into something you can use in a model.
The sequence matters: unlever first, then relever. Unlevered beta gives you the baseline business risk. Then, when you relever it to your target capital structure, you convert that business risk into the equity risk used for valuation. [27][4][13]
If your company has changing leverage and little trading history, keep the process simple with three steps:
That final step matters because it makes the beta line up with the risk that equity holders actually bear. And that's the levered beta you use in DCF, WACC, and board materials. [4][28][29]
Use unlevered beta for peer benchmarking and segment analysis. Use levered beta for pricing equity, fundraising, and hurdle rates. For M&A, use the combined entity's expected post-close capital structure. [17][25][27]
Use this table to choose the right beta and catch common mistakes.
| Aspect | Unlevered Beta | Levered Beta |
|---|---|---|
| Best for | Fundraising narratives, peer benchmarking, segment analysis | DCF models, board discount rates, M&A pricing |
| Growth-stage note | Use a peer set that reflects stage and growth profile | Relever to target D/E, not current leverage |
| Key check before using | Verify peer comparability; remove outliers and distressed companies | Confirm target capital structure matches realistic funding plans |
| Common mistake | Copying a sector average without unlevering for stage differences | Using a mega-cap's levered beta without adjusting for leverage or maturity |
Two points should stay front and center before you use either number.
First, beta is not static. If your business model changes, your risk profile shifts, or your capital structure moves, your beta assumption should move too.
Second, run a sensitivity check. Change the peer set. Adjust the target D/E ratio. Then see how much the valuation changes. If the output swings a lot, that's a sign the beta input needs a closer look before it lands in a board deck or investor model. [27][25][26]
Start with 5 to 10 public companies that look a lot like your business. Stick to companies with a similar industry, business model, and operating setup. Then compare things like revenue, geographic reach, growth stage, and financial profile.
Next, trim the list by removing companies that don’t fit your risk profile. If there aren’t many direct comps, look at adjacent industries or companies that sit a bit above or below your revenue range.
Consider setting beta above the peer median when the company carries risks that the median may miss. That can happen with industry-specific swings, a smaller operating scale, or lower liquidity.
Analysts handle this in a couple of ways. Some increase the beta directly. Others leave beta closer to the peer set and account for those risks with a separate size premium or liquidity premium.
Use your company’s target debt-to-equity (D/E) ratio when relevering beta.
With the Hamada-based reverse formula,
βL = βU × [1 + (1 − tax rate) × (Debt/Equity)]
the Debt/Equity input should match the capital structure you want the levered beta to reflect.
Put simply: if you’re estimating a beta for the business at its planned or long-run mix of debt and equity, use the target D/E ratio in the formula - not just today’s capital structure if that isn’t where the company is headed.



