Published on
July 27, 2026


LTV is not one number. The result changes based on whether I use revenue or gross margin, blended averages or cohorts, and past averages or segment-level behavior.
If I use the wrong model, my CAC math can break fast. A $1,200 revenue LTV becomes $600 at a 50% gross margin. And in SaaS, moving monthly churn from 1.5% to 3.0% can cut LTV from $106,667 to $53,333.
Here’s the short version:
Main takeaway: if I’m setting budgets, I should use profit-based LTV, keep lifespan estimates conservative, and avoid hiding weak performance inside blended averages.
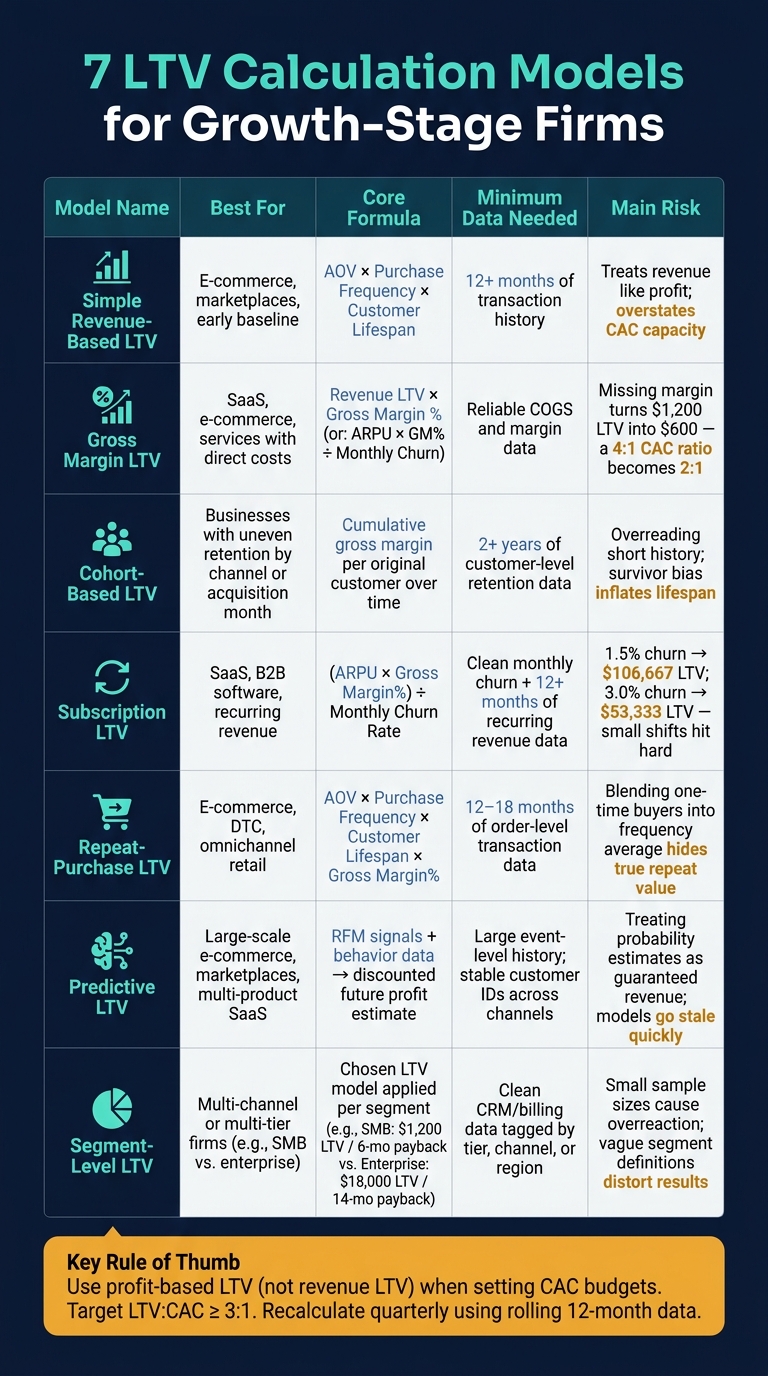
7 LTV Calculation Models: Which One Is Right for Your Business?

| Model | Best for | Main input | Main risk |
|---|---|---|---|
| Simple Revenue-Based | Early baseline | AOV, frequency, lifespan | Treating revenue like profit |
| Gross Margin LTV | CAC planning | Revenue LTV + margin % | Missing direct costs |
| Cohort-Based | Retention timing | Cohort retention and margin | Overreading short history |
| Subscription LTV | SaaS and recurring revenue | ARPU, margin, churn | Using one churn rate for all users |
| Repeat-Purchase LTV | E-commerce and DTC | AOV, repeat rate, lifespan | Mixing one-time buyers with repeat buyers |
| Predictive LTV | Large data sets | Behavior signals and margin | Treating forecasts like facts |
| Segment-Level LTV | Multi-channel or multi-tier firms | Segment-specific LTV inputs | Acting on small samples |
If I want a clean read on growth, I should match the LTV method to the business model, the data I trust, and the decision I need to make.
LTV ties together CAC, retention, gross margin, and payback. So the formula you use isn't just a math choice. It's a business choice that can change how you see growth.
A common rule of thumb is an LTV:CAC ratio of 3:1 or more for a model that can scale. Many investors push for an even higher ratio. But that only means something if LTV is defined the right way. For example, a $1,200 revenue-based LTV drops to $600 after applying a 50% gross margin adjustment. That takes a 4:1 CAC ratio and cuts it to 2:1.
That's where teams get into trouble. If you switch formulas in the middle of reporting, the picture can change fast. Revenue-based LTV and gross-margin-based LTV can lead to very different outputs from the exact same data. The same thing happens with blended and segmented views. A blended 3:1 ratio may look fine on the surface while weak segments drag down performance underneath.
For growth-stage firms, this matters a lot. LTV shapes how hard you can push acquisition spend, which segments should get more budget, and whether a retention or pricing move is worth the cost. Even a small drop in churn can have a big effect on LTV for high-value segments.
Good LTV models depend on clean data from billing, CRM, marketing, and accounting, along with shared definitions across teams. That's why the models below move from simple approaches to more precise ones.
Use this as the fastest baseline before you move to margin- or cohort-based models.
LTV = Average Order Value (AOV) × Purchase Frequency × Customer Lifespan
For e-commerce, the math is simple: AOV × purchase frequency × customer lifespan. AOV is revenue ÷ orders, and purchase frequency is orders ÷ unique customers. Customer lifespan is the average time from first to last purchase. In many cases, teams estimate it as 1 ÷ churn rate.
This model works best for e-commerce, marketplaces, and project-based services that get repeat business.
Use at least 12 months of clean transaction and retention data so seasonality doesn't skew the picture. If you can, use two years of cohort data for lifespan estimates. That gives you a steadier read.
If you don't have that much history yet, use a conservative estimate like 12 to 18 months for e-commerce. [1]
A common mistake is using revenue LTV by itself to set CAC budgets. That's risky. First convert it to gross margin LTV so you're working from profit, not just top-line sales.
Another issue: relying on one blended average. That can make performance look better than it is, because the top 10% of customers often drive 40% to 60% of revenue. [1]
If you need a profit-based view, move to gross margin LTV.
Revenue LTV is a good starting point. But gross margin LTV tells you what a customer is worth after direct costs. That means you're looking at profit, not just top-line sales.
Gross Margin LTV = Revenue-Based LTV × Gross Margin %
For SaaS and subscription businesses, the formula looks like this:
Gross Margin LTV = (ARPU × Gross Margin %) ÷ Monthly Churn Rate
That one change matters a lot. If you skip gross margin, your LTV can look stronger than it is.
Use this model when you can see both revenue and COGS with some confidence. It fits especially well for:
If your business has direct costs tied to serving customers, this model gives you a much more honest read than revenue LTV alone.
You need a few basics in place:
This model makes sense when a company can track COGS in a steady way, but doesn't yet have the depth for cohort analysis or predictive modeling.
The biggest mistake is simple: treating revenue like profit.
A $1,200 revenue-based LTV at 50% gross margin is actually $600. That's the figure that should shape budget calls.
Miss that margin adjustment, and it's easy to spend too much on acquisition. A 3:1 LTV:CAC ratio is the baseline health check here.
Gross margin LTV is still a blended view. If retention changes by acquisition month or by customer segment, cohort-based LTV is the next step.
Blended gross-margin LTV tells you how much value is in the business. But it can blur when customers drop off and which groups are doing the heavy lifting.
That’s where cohort LTV comes in.
Cohort LTV looks at customers who came in during the same time period and follows what they do over time. Usually, that means grouping people by acquisition month or quarter. You can also group them by channel. The point is simple: instead of guessing with one flat churn assumption, you watch how a real group behaves from day one.
Cohort-based LTV groups customers by acquisition date - most often month or quarter - or by acquisition channel, then tracks their behavior over time to estimate average customer lifespan and cumulative value. In plain English, you’re looking at what a specific batch of customers actually does after signing up or making that first purchase.
Cohort LTV = cumulative gross margin per customer
Track these inputs by cohort:
It also helps to split cohorts by acquisition channel so you can compare long-term value by source. A paid social cohort may look fine in month one, then fall apart later. An organic search cohort might do the opposite. That’s the kind of gap blended numbers can hide.
Define lifespan as the point when half the cohort has churned. [1]
Use this for non-subscription businesses with uneven purchase timing. It’s a strong fit when one blended churn rate hides big differences between cohorts. [1]
Cohort analysis works best when you have two or more years of clean customer-level retention data. You need to track each customer from first purchase through every checkpoint.
If you don’t have that yet, use conservative lifespan proxies:
Use those ranges until your data is deep enough to support something tighter. [1]
Cohort analysis is mostly a timing tool. It shows when value changes, not just how much value exists. That makes it more useful for acquisition and retention calls, where timing can change the whole picture.
A common mistake is claiming a long customer lifespan before the business has been around long enough to prove it. If your company is two years old, you can’t credibly claim a five-year average lifespan. [1]
Another easy trap is using only your oldest active customers to estimate lifespan. That group is made up of survivors, so the result will skew high. In other words, you’re looking at the people who stayed and ignoring the ones who already left. That will keep overstating how long the average customer sticks around. [1]
Before you plug cohort LTV into LTV:CAC, compare each cohort on a gross-margin basis. And if renewals happen on a fixed billing cycle, subscription LTV is the tighter model.
For recurring revenue, churn becomes the main driver. That’s why subscription LTV works best when revenue comes from contracts and renewals. It’s a tighter way to look at gross-margin LTV for recurring revenue, especially for SaaS and B2B software.
LTV = ARPU × Gross Margin % ÷ Monthly Churn Rate
ARPU means average revenue per account. Gross margin should include only direct service costs, not broad overhead. That usually means costs like:
Monthly churn is the share of customers who cancel each month.
Small shifts in churn can hit LTV hard. At $2,000 ARPU and 80% gross margin, LTV drops from $106,667 at 1.5% monthly churn to $53,333 at 3.0% churn.
Use this model for recurring-revenue businesses with fixed billing and renewal cycles, especially SaaS and B2B software. A useful benchmark is the median B2B SaaS LTV:CAC ratio of about 3.2:1 to 3.5:1 [3].
Early-stage teams can estimate churn. Later-stage teams need total CAC and granular COGS so gross margin stays accurate [3].
Once you have at least two years of retention data, add cohort analysis for a steadier view. That helps you see where 50% of a cohort has churned, which gives you a much better read on retention patterns [1].
A common mistake is using top-line revenue instead of gross margin. The math can look fine on the surface, but it inflates LTV. A $100,000 ACV product with an 80% gross margin adds $80,000 to LTV, not $100,000 [3].
Another trap is treating churn as if it stays the same across every customer group. It usually doesn’t. New subscribers often churn faster than long-tenure customers, so one blended rate can make early-stage risk look smaller than it is [1].
Add expansion revenue when upsells materially change account value.
If customers buy in repeated non-contract cycles, use repeat-purchase LTV next.
Use repeat-purchase LTV for transactional businesses with uneven, non-contract buying cycles. It’s a better fit than subscription LTV when customers come back on their own schedule instead of buying on a fixed plan.
LTV = Average Purchase Value × Average Purchase Frequency × Average Customer Lifespan
If you’re making margin-based calls, turn revenue LTV into profit LTV by multiplying it by gross margin %.
| Component | How to Calculate It | Common Misread |
|---|---|---|
| Avg. Purchase Value (APV) | Total Revenue ÷ Total Orders | Not splitting by product category, like a low-cost accessory vs. a high-ticket item |
| Avg. Purchase Frequency (APF) | Total Orders ÷ Unique Customers | Including one-time buyers, which drags down true repeat frequency |
| Avg. Customer Lifespan (ACL) | Use churn only for simple models; use cohort data for a tighter estimate | Using only repeat customers pushes lifespan too high |
| Profit-Based LTV | Revenue LTV × Gross Margin % | Using revenue instead of margin makes CAC capacity look bigger than it is |
The big trap here is simple: a blended average can look neat on paper, but it doesn’t describe every customer equally.
This model works best for transactional businesses that have repeat purchase behavior. If repeat purchases are rare, skip it. Otherwise, you’ll end up building forecasts on weak ground.
Use 12 to 18 months of clean transaction history. Then recalculate every quarter using rolling 12-month data.
The main risk is reading one-time purchase behavior as repeat value.
The biggest mistake is blending one-time buyers into the purchase frequency average. If a big chunk of customers never place a second order, blended APF makes loyal customers look less valuable than they are. That can hide the upside in retention work. A simple check helps:
Lifespan inflation is another common trap. If the business is only 2 years old, saying customers stay for 5 years is a bad read. Safer estimates usually win, especially when the history just isn’t there yet. And if you base lifespan on your longest-tenured active customers, the error gets worse. Those customers are survivors, not the average.
Also, track whether a second purchase happens within 60 days. That often points to much stronger long-term retention.
Predictive LTV estimates future customer value based on observed behavior, not just past spend. Put simply, it looks at what customers are doing now and uses that to project what they may be worth later.
It builds on cohort and repeat-purchase analysis by extending those patterns forward. That matters when old averages no longer reflect how current customers behave. In that sense, predictive LTV works as a bridge between historical cohort analysis and segment-level planning.
There isn't one formula that works for every business. Instead, teams use predictive models to estimate future profit based on signals like RFM, acquisition source, product mix, and gross margin.
This model works best for businesses with uneven customer behavior. Some customers buy once and disappear. Others stick around and turn into high-value repeat buyers.
That pattern shows up often in:
Use predictive LTV only when you have enough history to separate long-term retention from short-term noise. If you don't have that yet, stick with conservative lifespan estimates.
Once retention patterns settle down, segment-level LTV becomes the next move.
A common mistake is using revenue instead of profit. Revenue-based CLV can push acquisition budgets far too high. In some cases, that can lead to overspending by 2x to 5x [1]. If you're deciding how much to spend to win a customer, profit-based CLV is the number that should guide that call.
Another miss is survival bias. Lifespan should be based on the full customer base, not just the customers still active today. If you only look at survivors, you'll inflate customer value because early churn drops out of the picture.
Static models cause trouble too. Many founders treat LTV like a fixed number, even though customer behavior changes with product updates, pricing moves, and shifts in the market. Recalculate it quarterly [1]. And if customer lifespans run longer than three years, future cash flows should be discounted. A 10% discount rate can reduce a 5-year CLV by 15% to 20% [1].
Segment-level prediction helps here because top customers can hide weak segments. When customer value changes sharply by channel, product, or buyer type, use segment-level LTV.
When one model produces very different customer value by channel, plan, or buyer type, segment-level LTV helps turn that signal into a clear allocation call. You run the same LTV model for each customer group, then compare retention, margin, and payback without hiding the differences inside a blended average. The goal isn’t more slicing for the sake of it. It’s better budget, pricing, and sales allocation.
The idea is simple: use the same LTV logic you already use, but apply it to each segment on its own.
Start with Segment LTV = Segment ARPU × Segment gross margin % × Segment lifespan.
For repeat-purchase and subscription businesses, the logic stays the same. The difference is that each input is calculated within that segment instead of across the whole customer base.
This model tends to work best once a company has multiple channels, pricing tiers, or customer types. A SaaS company, for example, might split customers into SMB, mid-market, and enterprise and find that the LTV, CAC, and payback profile changes a lot from one group to the next.
A simple example makes the point:
SMB customers might generate an average LTV of $1,200 with a 6-month payback, while enterprise customers generate $18,000 but require a 14-month payback and a much higher sales expense [4].
That kind of gap changes how you think about sales coverage, pricing, and where to put the next dollar.
You need clean customer-level data, stable segment labels, and a revenue history you trust. As teams mature, this usually means stable tags, consistent revenue recognition, and clean channel attribution.
Early-stage teams can still start with spreadsheet-level segmentation. That said, the model becomes more dependable when segment definitions stay fixed and sample sizes are large enough to separate actual patterns from noise.
If a segment is very small, or the data is incomplete, treat the output as directional rather than decision-grade.
A common mistake is assuming the highest-LTV segment is automatically the best place to grow. That’s not always true.
The better question is which segment produces the best contribution margin after CAC, and how long it takes to earn that CAC back. So before shifting budget, pair segment LTV with segment CAC and payback. One number on its own rarely tells the whole story.
Use this model when you need a fast baseline and only have transaction totals, not cohort or margin data. If direct costs matter, the next step is gross margin LTV.
The basic formula is LTV = Average Purchase Value × Average Purchase Frequency × Average Customer Lifespan.
For e-commerce brands, that maps cleanly to AOV × orders per year × average customer lifespan. For subscription businesses, lifespan comes from churn. A monthly churn rate of 5% means an average lifespan of 20 months (1 ÷ 0.05). [1]
This model fits e-commerce, marketplaces, and project-based services with repeat purchases. It’s also handy when you want a quick gut check on CAC targets.
You only need three inputs:
Those numbers should cover at least 12 months. [1] You don’t need event-level data, cohort tables, or a margin breakdown yet.
If you don’t have enough history, use conservative lifespan estimates instead. A common starting point is 12–18 months for e-commerce and 24–36 months for B2B. [1]
The biggest mistake is treating this like a profit metric when it’s a revenue metric. That mix-up can get expensive fast. If you use revenue-based LTV to set acquisition budgets without adjusting for gross margin, you can overspend by a lot. The simple fix: multiply revenue-based LTV by your gross margin percentage to get profit CLV before you compare it with CAC.
Another common miss is overstating lifespan. If your business is less than two years old, projecting a 5-year customer lifespan is speculative and risky. [1]
There’s also the blended-average problem. One top-line LTV number can hide big differences between customer groups. On paper, the “average” customer may look worth more than they are.
If you can split direct costs from revenue, move to gross margin LTV next.
Gross margin LTV is the go-to acquisition metric when direct costs are part of the picture. It’s the first step up from revenue-based LTV because it strips out the direct cost of serving customers before you make CAC calls. That gives you customer value after direct costs, not just top-line revenue.
For most businesses, start with revenue-based LTV and apply gross margin:
Gross Margin LTV = (Avg. Purchase Value × Frequency × Lifespan) × Gross Margin %
For SaaS and subscription businesses, lifespan usually comes from churn:
Gross Margin LTV = (ARPU × Gross Margin %) ÷ Monthly Churn Rate [1][3]
Here’s a simple example. If a SaaS product has $500 ARPU, 80% gross margin, and 2% monthly churn, its gross margin LTV is $20,000. Not $25,000, which is the revenue-based number. That difference matters when you’re setting CAC targets.
Gross margin LTV fits best for SaaS, subscription, and e-commerce businesses where direct costs can be measured with some confidence. It starts to matter a lot once you can cleanly separate revenue from the cost to serve each customer.
This model depends on direct-cost accounting. COGS should include costs like:
If those costs are missing, gross margin looks better than it is, and LTV gets overstated.
The most common mistake is comparing CAC against revenue-based LTV instead of gross margin LTV. That can make unit economics look far better than they are and push teams to overspend on acquisition by 2–5x [1].
Another mistake is using one blended gross margin across the whole business. On paper, that sounds fine. In practice, it can hide weak economics in a certain segment, tier, or channel. Different customer groups often cost different amounts to serve, so the cleaner move is to calculate gross margin LTV by segment, acquisition source, or product tier before deciding where to put more budget [1].
Once gross margin LTV is stable, cohort LTV helps you see how customer value shifts by acquisition month and channel.
Once gross-margin LTV is in place, cohort LTV shows how customer value shifts by acquisition month or channel. Instead of guessing lifespan, you follow each acquisition cohort over time and watch what it does. That matters when blended averages smooth over retention gaps or channel differences. Cohort LTV makes it easier to spot whether newer customers are turning out better or worse than older ones.
A cohort is a group of customers who share the same acquisition trait, most often the month they were acquired. When your tagging is dependable, you can add channel or segment on top.
Track each acquisition cohort over time, then look at cumulative gross margin per original customer to judge payback and retention.
Cohort LTV = cumulative gross margin per original customer over time, discounted if needed
where T is the observation horizon, such as month 12 or 24, and r is an optional discount rate applied each period.
Use the curve to see when LTV starts to level off. Until it flattens, label the result by time horizon, like 12-month or 24-month LTV. [2][5][8]
Use this method when retention or monetization changes by acquisition month, channel, or product.
This method usually needs 12 to 24 months of customer history to produce curves you can trust. At minimum, you need:
If you also want channel or segment cohorts, those fields need to be tagged the same way from day one. If attribution is incomplete, you're often stuck with monthly cohorts only, which makes analysis less useful. [2][5][8]
Without enough history, it's easy to mistake early behavior for lifetime behavior.
Don't blend all cohorts into one average. That wipes out the whole point of cohort analysis: seeing whether newer cohorts are getting better or slipping compared with older ones. [6][8]
Also, don't lean on old cohort behavior after a pricing, product, or channel shift. Older cohorts reflect the setup those customers came in under, so their curves may no longer fit the current business. [8][7]
Use this table to compare time horizon with reliability.
| Method | Required Data Horizon | Reliability Level | Main Risk of Misinterpretation |
|---|---|---|---|
| Revenue cohort LTV | 6–12 months | Medium | Overstates unit economics if margin data are missing |
| Gross-margin cohort LTV | 12–24 months | High | Requires accurate cost attribution; harder to build |
| Acquisition-month cohorts | 12–24 months | High | Simpler and stable, but misses channel-level differences |
| Channel cohorts | 12–24 months | Medium–High | More actionable, but noisy if attribution is inconsistent |
| 6-month LTV | 6 months | Low–Medium | Often incomplete; misses long-tail retention and revenue |
| 24-month LTV | 24 months | High | More reliable for planning, valuation, and CAC strategy |
Longer horizons and gross-margin views usually make the read more dependable. Shorter windows and blended cohorts make it easier to misjudge acquisition spend or channel mix.
If buying happens on a fixed billing cycle, move to subscription LTV next. If purchases are irregular, use repeat-purchase LTV.
Use this when churn, not purchase frequency, drives lifetime value.
For recurring-revenue businesses, subscription LTV uses ARPU, gross margin, and monthly churn. If your revenue is fairly predictable, this is the cleanest way to turn margin into lifetime value.
Subscription LTV = (ARPU × Gross Margin) / Monthly Churn Rate
The implied lifetime is 1 ÷ churn rate, which means even small churn shifts can change LTV a lot. Drop monthly churn from 2% to 1.5%, and LTV jumps 33%. [1]
If customer lifespans go beyond 3 years, discount future cash flows.
This model fits companies with predictable renewals and steady churn tracking. It works best when recurring revenue and churn are measured the same way over time.
You need clean recurring-revenue reporting and a clear view of churn, including both logo churn and revenue churn. Use at least 12 months of data so seasonality doesn't skew the result. [1] [3]
A common mistake is using logo churn on its own. That misses account size, which is why revenue churn is the better input for financial modeling. [3]
Another mistake is treating short-term churn like it will stay flat across the full customer lifespan. In practice, newer customers often churn more than long-term customers. That means early data can make lifetime numbers look better than they are. If the business is still early, use conservative estimates - 24 to 36 months for B2B - until cohort data is strong enough to back up the assumption. [1]
The third mistake is skipping gross margin. If you use top-line revenue instead of gross-margin-adjusted revenue, you can overstate LTV by 20% to 30% or more. That can make your LTV:CAC ratio look stronger than it is. [3]
"Every budget argument gets easier when you know your CLV. If a customer is worth $2,400 over 3 years, spending $300 to acquire them isn't expensive. It's an 8:1 return. Without CLV, every acquisition cost feels like a gamble." - Hardik Shah, Founder, ScaleGrowth.Digital [1]
If purchases are irregular instead of contract-based, use repeat-purchase LTV next.
| Formula Variant | Inputs Required | Pros | Cons | Best Used When |
|---|---|---|---|---|
| Basic: ARPU / Churn | ARPU, monthly churn | Fast, easy to calculate | Ignores margin; can overstate value | You need a fast baseline |
| Gross Margin LTV: (ARPU × GM%) / Churn | ARPU, gross margin, churn | Profit-based; better for CAC decisions | Requires clean COGS tracking | Standard financial modeling |
| Discounted LTV | ARPU, GM%, churn, discount rate | Accounts for time value of money | More complex; requires a lifespan estimate | Customer lifetimes extend beyond 3 years |
| Segment LTV by tier | ARPU, GM%, churn per segment | Shows tier-level differences | Requires segment-level data | Different customer tiers need separate budgeting |
| Net revenue churn variant | ARPU, GM%, net churn | Shows expansion upside | Negative churn breaks the 1/churn shortcut [3] | Measuring overall business health |
Use this when customers buy more than once, but not on a set renewal schedule. It fits e-commerce, DTC, marketplaces, and omnichannel retail, where repeat orders drive most of the value. In this setup, purchase cadence matters more than churn.
Repeat-Purchase LTV = AOV × Purchase Frequency × Customer Lifespan × Gross Margin %
Each part has a simple way to calculate it:
| Component | How to Calculate |
|---|---|
| AOV (Average Order Value) | Total revenue ÷ total orders over a set period |
| Purchase Frequency | Total orders ÷ unique customers over 12 months |
| Customer Lifespan | Cohort analysis, or 12–18 months if cohort data is limited |
| Gross Margin % | (Revenue − COGS) ÷ Revenue |
Use at least 12 months of data when you calculate AOV and purchase frequency. That helps smooth out seasonal swings and gives you a steadier baseline.[1]
This model works best when customers come back on their own timeline instead of a subscription schedule. That becomes even more important when buying frequency shifts by category, channel, or customer type.
You’ll need order-level transaction data, a way to track repeat purchase rates, and at least basic margin visibility by product or category. If you don’t have cohort data yet, use conservative estimates of 12 to 18 months for e-commerce.[1]
Two mistakes show up all the time here.
If those patterns shift by segment, predictive LTV is the next step.
When cohort data and repeat-purchase trends stop matching what customers are doing now, predictive LTV helps you look ahead instead of backward. The models covered earlier lean on past averages. Predictive LTV does something different: it estimates future value based on the signals each customer is giving you today.
At its core, it usually starts with RFM data, then layers in channel and retention signals when you have them.
There isn't one fixed formula here. Predictive LTV is a modeling setup that estimates a customer's chance of staying active, how often they'll buy again, how much they'll spend, and the discounted cash flow from those future purchases.
One signal matters a lot: a second purchase within 60 days is a strong retention signal. [1]
This model works best for growth-stage companies with large customer bases, lots of behavior data, and marketing spend spread across many decisions.
This approach asks more from your data stack than any other model in this list. You need:
The biggest mistake is treating the model's output like a promise instead of what it is: a probability-based estimate. Predictive LTV shows what's likely, not what's guaranteed. If you treat it like locked-in revenue, it's easy to spend too much on acquisition.
Another common miss is letting the model get stale. Pricing changes and shifts in the market can change customer behavior fast, so predictive models should be refreshed at least quarterly using rolling 12-month data. [1]
A third mistake is assuming early-adopter behavior will hold for future cohorts. Early customers are often more loyal than the average customer you acquire once you scale, which means a model trained too heavily on that group can overstate future LTV. [1]
When customer value swings hard by channel, tier, or buyer type, the next step is segment-level LTV.
Blended LTV can hide big differences between customer groups. That’s the whole reason to break it out by segment.
Segment-level LTV means applying the right LTV model to each group - by channel, tier, geography, or sales motion - instead of rolling everyone into one company-wide number. A single LTV figure can look healthy on paper while strong groups cover up weak ones that are losing money once CAC is factored in.
Use segment-level LTV when the right model changes by customer group.
Segment LTV = the chosen LTV model applied to one segment’s revenue, margin, churn, or repeat rate.
The model should match how that segment buys:
This matters most when differences by channel or tier change CAC payback.
If you run both self-serve and sales-led motions, those groups almost always have different ARPU, churn, and CAC. So their LTV will be different too. Blend them together, and you get a number that doesn’t cleanly describe either group.
A DTC brand might see paid social customers at an LTV of $180 against a CAC of $90, while organic customers show an LTV of $260 with a CAC of just $20. [11] The blended view may look fine. But the segment view makes the gap obvious and shows where spend is doing more work.
This only works if your segment tags and customer history are clean enough to trust.
UTM source, pricing plan, region, and customer size tier need to flow from acquisition through your CRM and into billing data. If that chain breaks, segment LTV gets messy fast.
Each segment also needs enough observations to give stable estimates. Segments with fewer than a dependable minimum number of customers, or less than 6–12 months of retention data, are too noisy to guide major decisions. [9] [10]
Three mistakes show up again and again.
Pick the simplest model that fits two things: your buying pattern and the data you trust. That’s the easiest way to avoid overcomplicating LTV too early. The summary below turns those two checks into a quick stage-based rule, based on the seven models covered above.
Start with revenue-based LTV if you have 12+ months of transaction history. Move to gross margin LTV once your margin data is clean. Save cohort LTV for the point when you have 2+ years of retention history.
Use this table as a quick filter, not a replacement for the model definitions above.
| LTV Model | Minimum Data Needed | Use First? |
|---|---|---|
| Simple Revenue-Based | At least 12 months of transaction history | Yes, for early-stage firms |
| Gross Margin LTV | Reliable margin data | Yes, once margin data is clean |
| Cohort-Based | 2+ years of historical retention data | When cohort patterns are established |
| Subscription LTV | Clean monthly churn data | Yes, when churn is stable |
| Repeat-Purchase LTV | Enough purchase-frequency data to identify repeat behavior | Yes, for e-commerce with repeat buyers |
| Predictive LTV | Enough historical data to forecast behavior with enough confidence to act | Once your data set is large enough |
| Segment-Level LTV | CRM or accounting data broken out by tier, product line, or acquisition channel | Yes, when customer groups differ meaningfully |
You don’t have to force one LTV model to do every job.
Use one model for company-wide reporting and another for channel, cohort, or segment decisions. Different models answer different questions: reporting, acquisition efficiency, retention, and segmentation. If you try to squeeze all of that into one number, it usually ends up doing none of it well.
That setup keeps the headline metric stable while the operating metric stays useful.
Recalculate each model quarterly using rolling 12-month data. [1]
Taken as a whole, these models move from quick back-of-the-napkin estimates to analysis you can use for high-stakes decisions.
There isn't one LTV formula that works for every company. The right choice depends on your business model, the quality of your data, and the decision you're trying to make.
The three mistakes that show up again and again are ignoring margin, stretching customer lifespan too far, and leaning on blended averages that hide the gap between customers who are still active today and those who already churned.
These seven models each solve a different problem. Start with the simplest one your data can support, then move up as your business grows and your numbers get cleaner. If two models point in different directions on a big decision, that's your cue to look closer - not to grab the number that looks nicer.
The next move is simple: choose the model that fits your current data, not the one that spits out the highest LTV.
LTV only matters if it matches reality. Ground it in current retention and margin data, then use it to guide budget, pricing, and customer acquisition decisions.
If you're at the pre-seed or seed stage and your business model is fairly stable, start with the simple revenue-based LTV model. It gives you a clear blended picture of customer value, which makes it useful for planning and board updates.
As the business grows and things start to change more often, switch to cohort-based LTV. This matters most when acquisition channels, pricing, or retention begin to move.
Gross margin LTV is the better metric for CAC decisions because it shows actual profit, not revenue that looks bigger on paper than it is.
That matters a lot in low-margin businesses. If you use revenue-based LTV, you can end up overstating customer value by as much as 3x. And when that happens, higher acquisition spend can seem justified when it isn’t.
Once you include the cost of delivering the product, gross margin LTV gives you a much more realistic LTV:CAC ratio. In plain English, it shows how much cash is left to help cover operating expenses and keeps you from spending too much on acquisition.
Switch from blended to cohort or segment LTV once your business stops being simple and steady. That usually happens when you scale spend across several acquisition channels, change pricing, or start seeing retention drift in certain customer groups.
Blended LTV works for top-line reporting. But it can hide weak spots for 12 to 18 months. And that’s a long time to fly half-blind.
If blended LTV and cohort-based LTV point in different directions, trust the cohort view for day-to-day decisions and capital allocation. It shows what’s happening underneath the average, which matters a lot more when money is on the line.



