Published on
August 7, 2026


Most U.S. growth firms with $500,000 to $10,000,000 in revenue are still spending heavily. In this range, total OpEx often runs from 90% to 120% of revenue at $1M–$5M and 85% to 110% at $5M–$10M. If I want to judge spend the right way, I need to look at revenue band, growth rate, and headcount cost together, not one ratio by itself.
Here’s the short version:
A few takeaways stand out. If G&A is above peer range at low revenue, that can point to overhead drift. If S&M is too low, growth may stall. And if payroll keeps climbing without matching revenue or margin gains, that is a warning sign.
| Area | What I should check |
|---|---|
| Revenue band | Am I comparing myself to firms of similar size? |
| Growth rate | Am I spending like a slow-growth or high-growth company? |
| Cost mix | Is S&M, R&D, or G&A too high for my stage? |
| Headcount | Are people costs taking too much of OpEx? |
| Productivity | Is revenue per employee moving up or down? |
This piece works best as a reference point for planning, budgeting, and board prep - not as a target I need to copy line by line.
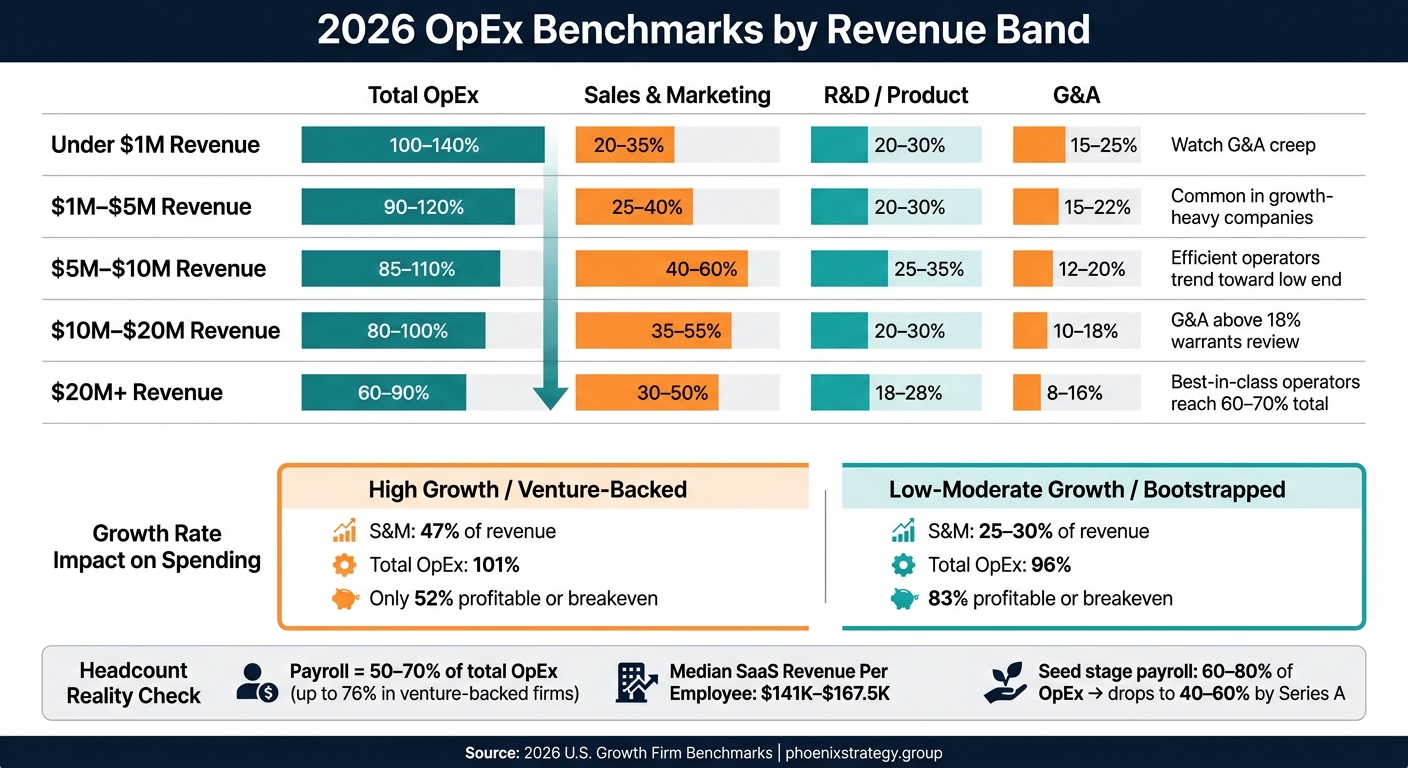
2026 OpEx Benchmarks by Revenue Band: Growth Firm Spending Ranges
Companies with less revenue usually carry more OpEx as a percentage of revenue. Fixed costs show up first. Scale comes later. Once growth picks up, spending patterns start to split in different directions.
For U.S. growth firms, a useful set of revenue bands is under $1M, $1M–$5M, $5M–$10M, $10M–$20M, and $20M+.[5][2] In the under $1M band, total OpEx often lands around 100–140% of revenue. More aggressive companies can run at 140–200%+ when outside funding is paying for product buildout and go-to-market.[7][5]
In the $1M–$5M range, total OpEx usually falls between 90–120%. Teams that watch spend closely tend to sit near 90%, while firms pushing for growth often move closer to 120%.[5][2][6] By $5M–$10M, total OpEx often comes in around 85–110%, and lean operators can get down to 65–85%.[2][3]
Above $10M, many efficient operators bring total OpEx below 80% of revenue. At $20M+, best-in-class companies can get to about 60–70%.[2][4][7]
The mix of spending changes just as much as the total spend. In the early days, SG&A is often loaded up front. Founder-led sales, basic finance, legal, HR, and executive costs can make G&A look high as a share of revenue, mostly because the revenue base is still small.[5][7]
In the $1M–$5M band, Sales & Marketing often climbs to 25–40% as companies add sales reps and put more money into demand generation. During that same stage, R&D usually stays near 20–30%, while G&A often sits around 15–22%.[5][6][2]
By $5M–$20M, Sales & Marketing is often the biggest operating bucket. G&A usually moves down toward 10–18%, and the overall mix starts to show more leverage as revenue grows faster than overhead.[2][8]
As revenue grows, the cost mix tends to move from fixed-cost heavy to a model with more leverage. The table below shows the usual pattern.
| Revenue Band | Total OpEx | Sales & Marketing | R&D / Product | G&A | Profile Note |
|---|---|---|---|---|---|
| Under $1M | 100–140% | 20–35% | 20–30% | 15–25% | Watch G&A creep |
| $1M–$5M | 90–120% | 25–40% | 20–30% | 15–22% | Common in growth-heavy companies |
| $5M–$10M | 85–110% | 40–60% | 25–35% | 12–20% | Efficient operators trend toward the low end |
| $10M–$20M | 80–100% | 35–55% | 20–30% | 10–18% | G&A above 18% warrants review |
| $20M+ | 60–90% | 30–50% | 18–28% | 8–16% | Best-in-class operators often reach 60–70% total |
A company running at 110% total OpEx in the $5M–$10M band isn't automatically in trouble. But it does need growth and retention that are strong enough to justify that spend.[2][3]
Revenue band tells you how big a company is. Growth rate tells you how hard that company is pushing.
The revenue-band table covers company size. This section looks at something different: how growth rate changes the way companies spend at the same size.
Growth rate is one of the main drivers of S&M spend. At the same revenue level, faster-growing companies usually put more into Sales and Marketing. That extra spend tends to buy growth speed, not leaner performance.
Use the cohort view below to compare your S&M intensity, total OpEx, and breakeven profile with peer groups.
| Growth Profile | S&M (% of Revenue) | Total OpEx (% of Revenue) | Profitability Rate |
|---|---|---|---|
| High Growth (Venture-Backed) | 47% [9] | 101% [9] | 52% profitable/breakeven [9] |
| Low/Moderate Growth (Bootstrapped) | 25%–30% [9] | 96% [9] | 83% profitable/breakeven [9] |
The pattern is pretty clear. Venture-backed, high-growth companies spend far more on S&M, and their total operating spend often runs above revenue at 101% [9]. At the same time, only 52% are profitable or at breakeven [9].
Bootstrapped companies in the low-to-moderate growth group take a different path. Their S&M spend lands at 25%–30% of revenue [9], total OpEx sits at 96% [9], and 83% are profitable or at breakeven [9]. Same size, different playbook.
G&A is often where the discipline gap shows up most clearly across growth cohorts. Fast-growing companies tend to carry more G&A in dollar terms as they build out finance, HR, and legal before scale fully arrives.
But there’s an important catch: as a share of revenue, G&A should still come down over time. If it doesn’t, that can be a sign that back-office costs are getting ahead of the business. Since headcount drives most OpEx, the next thing to check is staffing by function, not just total spend.
Once you’ve set your revenue-band and growth-rate benchmarks, the next step is headcount spend. In most startups, headcount is the main driver of OpEx. Payroll-related costs can reach about 76% of OpEx in venture-backed startups.[15] At the seed stage, payroll often lands in the 60%–80% range of OpEx, then drops to 40%–60% by Series A and later.[14]
The key figure here isn’t just base salary. It’s fully loaded compensation: salary, employer taxes, benefits, retirement, bonuses, stock comp, and contractor labor that works like headcount. You want to measure headcount spend in two ways:
That gives you a cleaner view of how much of the business is going toward people costs.
Revenue per employee, or RPE, is a simple productivity check. In private SaaS data, median RPE now sits around $141,000–$167,500.[10][11][12]
| RPE Range | Benchmark |
|---|---|
| Below $100K | Below $100K |
| $100K–$200K | $100K–$200K |
| $200K–$300K | $200K–$300K |
| Above $300K | Above $300K |
Don’t just look at the number in isolation. Watch the direction too. If RPE is falling quarter over quarter, hiring is moving faster than productivity.
Total payroll as a percentage of revenue only tells part of the story. Where that headcount sits matters just as much. This is a check on where the dollars go across functions, not just how much you spend overall.
At high-growth SaaS companies, R&D and product often run near 20% of revenue, while G&A usually drops from 16%–20% at $30M–$50M in revenue to 8%–12% at larger scale.[16][17][18] Sales and marketing usually becomes the biggest functional bucket for most growth firms.[18]
A couple of patterns deserve extra attention:
Those issues can sneak up on a company. One points to back-office bloat. The other can hit retention before the problem shows up in the budget.
These ratios work well in a simple peer screen. For most founders, a four-step process is enough:
The point isn’t to match peers line for line. It’s to see whether the gap is buying growth, retention, or productivity. Phoenix Strategy Group can help founders turn these ratios into repeatable FP&A dashboards and hiring plans.
Once you’ve looked at revenue bands, function mix, growth rates, and headcount, the next step is using those numbers without reading too much into any single metric.
Sales & Marketing often lands around 37% to 48% of OpEx[1][22]. That’s not a goal. It’s a range. And ranges only help when you look at them through all three lenses: revenue band, function, and growth rate.
Don’t tune one ratio on its own. If a company cuts G&A just to line up with a peer median, while payroll intensity is climbing and CAC payback is getting worse, that doesn’t fix the business. It just covers up the issue.
G&A as a share of ARR has moved from roughly 11% to about 14% in some datasets as compliance and infrastructure costs went up[4][23]. So a ratio that looked healthy last year may not look healthy now.
The simplest way to use this data is to pressure-test it against four rules.
Phoenix Strategy Group helps founders turn benchmark reviews into FP&A, budgeting, and board-reporting discipline.
Start with your current ARR or total annual revenue. Revenue bands matter because growth targets and efficiency standards shift as a company gets bigger. A business in the $1 million to $5 million range shouldn't be measured against one doing more than $50 million.
For peer benchmarking, compare your company with businesses that are within about 20% of your revenue. If you don't have many good matches, keep the sector and revenue band the same before loosening anything else.
At your stage, high operating expenses (OpEx) often signal inefficiencies that can eat into profit and make it harder to keep the business healthy over time. If OpEx is climbing faster than revenue, overhead may be growing faster than the company itself. That puts pressure on EBITDA.
A few red flags tend to show up early:
When you see patterns like these, it usually means costs are drifting up without a matching return.
Start by pulling payroll and accounting data into one dashboard. That gives you a clean view of headcount and compensation, so reporting stays accurate instead of turning into a spreadsheet mess.
For revenue efficiency, track ARR per employee. In 2026, the median was 129,724. Then compare your payroll and revenue-per-employee numbers against industry benchmarks for your revenue stage. That helps you see whether team scaling matches growth or if hiring is getting ahead of the business.
Phoenix Strategy Group can help connect payroll and financial data so you can model these metrics in one place.