Published on
August 31, 2026


Fast sales growth can drain cash before the money comes in. I’d sum it up like this: if sales rise, but cash gets stuck in inventory and unpaid invoices, a company can look fine on paper and still run into a cash shortfall.
Here’s the plain-English version:
A few numbers make the risk clear:
If I saw revenue going up while operating cash flow stayed flat or turned negative, I’d treat that as a warning sign right away. That usually means each new dollar of sales is tying up more cash than the business can spare.
| What I’d check first | What it can tell me |
|---|---|
| Cash on hand | Whether payroll and near-term bills are covered |
| 13-week cash view | Whether a cash gap is coming soon |
| Receivables aging | Whether customers are paying too slowly |
| Inventory days | Whether stock is tying up too much cash |
| Payables timing | Whether suppliers are being stretched |
| Credit line usage | Whether the business is leaning too hard on debt |
The main point is simple: growth is not always a win if cash can’t keep up. This piece explains the warning signs, the root causes, and the steps I’d take to keep growth lined up with working capital.
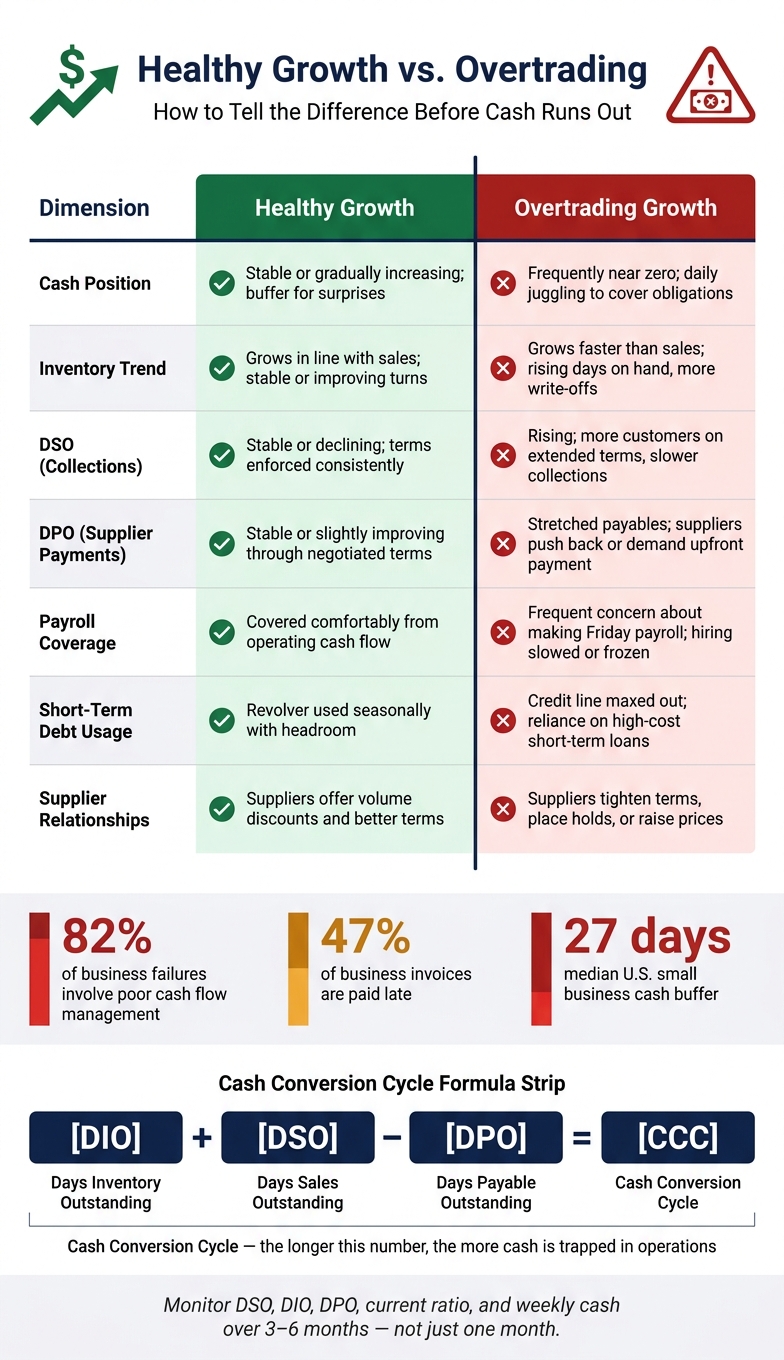
Healthy Growth vs. Overtrading: Key Warning Signs & Metrics
The clearest way to spot the cash gap is through the cash conversion cycle. The cash conversion cycle, or CCC, shows how long cash stays trapped in inventory and receivables before customers pay and the money comes back in. The formula is CCC = Days Inventory Outstanding (DIO) + Days Sales Outstanding (DSO) – Days Payable Outstanding (DPO).
On paper, a jump in sales can look great. But the math underneath can tell a very different story. When sales doubled, looser payment terms and higher inventory pushed CCC from 30 to 80 days. That shift tied up more than $2 million in extra cash, even though gross profit also doubled on paper.
Once that gap gets bigger, the strain doesn’t stay hidden for long. It tends to hit stock levels, payroll, and supplier payments first.
This pressure usually appears in three places: inventory buildup, payroll timing, and stretched payables.
Operations teams often place larger orders to keep up with growth forecasts. That sounds sensible, but it also locks cash into stock that hasn’t sold yet. Payroll, meanwhile, keeps coming every two weeks whether customer payments have arrived or not. Then supplier invoices land on net-15 to net-30 terms, all competing for the same limited cash that’s already tied up in inventory and wages.
When all three hit at once, management ends up making weekly triage decisions. One vendor gets paid now. Another gets pushed back. Suppliers notice fast. Some shift accounts to cash on delivery (COD), while others stop shipments altogether. Short-term borrowing can plug the hole, but it adds interest expense and quietly eats into the margins that made the growth look so good at first.[5] And once that cycle starts, it’s tough to stop.
The same jump in sales can point to healthy expansion - or to hidden overtrading. Here’s what that difference looks like side by side.
| Dimension | Healthy Growth | Overtrading Growth |
|---|---|---|
| Cash position | Stable or gradually increasing; buffer for surprises | Frequently near zero; daily juggling to cover obligations |
| Inventory trend | Grows in line with sales; turns stable or improving | Grows faster than sales; rising days on hand, more write-offs |
| DSO (collections) | Stable or declining; terms enforced consistently | Rising; more customers on extended terms, slower collections |
| DPO (supplier payments) | Stable or slightly improving through negotiated terms | Stretched payables; suppliers begin pushing back or demanding upfront payment |
| Payroll coverage | Covered comfortably from operating cash flow | Frequent concern about making Friday payroll; hiring slowed or frozen |
| Short-term debt usage | Revolver used seasonally with headroom | Credit line maxed out; reliance on credit cards or high-cost short-term loans |
| Supplier relationships | Suppliers offer volume discounts and better terms | Suppliers tighten terms, place holds, or raise prices to offset perceived risk |
Healthy growth builds capacity. Overtrading burns through cash faster than the business can bring it back in.
One of the first things to watch is where the founder's time goes. If more of it is getting pulled away from strategy and into cash worries, delivery issues, and vendor firefighting, that's often an early sign of overtrading. Growth may look good on paper, but it can still drain cash. That's usually the point where working capital starts to lag behind the pace of the business.
A few warning signs tend to show up early: payroll depends on this week's collections, suppliers start tightening terms or holding shipments, and stockouts show up at the same time the backlog keeps growing. That mix usually means operations are moving faster than the working capital available to support them.[6][10][12]
This doesn't just hit product-based companies. Service firms and SaaS businesses can run into the same problem. Overbooked teams, support queues getting longer, missed service-level agreements, and lower customer satisfaction scores point to the same kind of strain that manufacturers see with stockouts or delayed shipments.[8][9]
Don't judge this from one month's numbers. Look at the trend over three to six months. A single snapshot can hide what's going on underneath.[7][2]
A current ratio, calculated as current assets divided by current liabilities, that keeps drifting toward or below 1.0 while revenue keeps rising is a classic warning sign. It usually means growth is being funded with a thinner and thinner liquidity cushion.[1][2] If the quick ratio is falling at the same time, the message gets even clearer.
Another pattern to watch is DSO, DIO, and DPO all moving up together.[11][15] That's a rough setup: customers are taking longer to pay, inventory is sitting longer, and the company is stretching supplier payments to make up the gap. If DSO and DIO go up while DPO stays flat, the pressure hits cash even harder because suppliers aren't carrying any of it.
One metric that often gets missed is the operating cash flow to sales ratio. If revenue is up but operating cash flow is flat or negative, each new $1 of sales is using more working capital than it brings in.[1][12] That split between sales growth and cash flow often shows up before the bank balance starts to crack.
A simple weekly dashboard can help founders step in before a cash shortfall turns into a full-blown problem.[13][14][17][18]
| Dashboard Item | What to Track | Warning Threshold |
|---|---|---|
| Cash on hand | Bank balance vs. cash floor tied to payroll and critical payments | Below one month of payroll[13][14] |
| 13-week cash outlook | Projected inflows and outflows by week | Any week projected below cash floor |
| Receivables aging | Share of AR in 31–60, 61–90, and 90+ day buckets; total DSO trend | More than 20% of AR past 60 days[15][16] |
| Inventory days (DIO) | Days of inventory on hand vs. sales growth rate | Inventory days rising faster than sales |
| Payables due | Total due in the next 2–4 weeks; vendors approaching credit limits | Payables bunching in near-term dates |
| Borrowing utilization | Line-of-credit usage and available headroom | Credit line usage rising quickly |
When several of these indicators weaken at the same time, the problem usually isn't demand. It's working capital. Shrinking cash buffers, aging receivables getting worse, and more reliance on the credit line are the signals that matter most.[13][14][17] Give one person clear Monday ownership - usually the controller or finance lead - and review any metric that crosses its threshold.
In many cases, these warning signs trace back to weak capital planning, loose collections, poor inventory control, or limited financial visibility.
Those warning signs usually trace back to three problems: growth plans that move faster than funding, weak control over working capital, and limited financial visibility. The first step is simple: figure out which one is putting the most pressure on cash.
Fast growth can look smart on paper and still create a cash crunch.
A distribution company might win a national retailer contract and then stack up new costs before any money comes in. That can mean adding $80,000 in monthly payroll before the first order ships, committing to a 40% inventory increase, and taking on net-60 terms to close the deal. In one move, DSO can jump from 32 days to 58 days, while the credit line is still sized around last year's smaller receivables.[23][25]
That’s the heart of the problem: growth does not cause capital to expand on its own.
If founders don’t line up more equity, renegotiate credit lines, or set up asset-based lending before making a big push, the business ends up paying for expansion with working capital alone.[3] And that’s where the squeeze starts. Cash gets tight first. Supplier pressure usually follows right behind it.
Even when a company has enough funding, weak day-to-day control can still widen the gap.
A few common habits do the damage:
Each one pushes DSO or DIO higher, pulls DPO lower, and leaves the company funding a bigger working-capital gap.[3][7][12] In many cases, that gap gets covered with short-term borrowing, which adds even more strain.
A lot of founders track revenue more closely than cash.
Without a rolling forecast, an integrated financial model, or a weekly cash review, it’s easy to approve hiring plans or large purchase orders based on pipeline numbers while missing the timing of the cash needed to support them.[1][8][24] Revenue may be coming. The problem is that payroll, inventory, and vendors usually can’t wait.
Weak governance makes this worse. You see it when there’s no formal review of cash and working capital at the board or leadership level, when financial decisions sit with one founder and there’s no finance lead, and when there are no written rules for credit terms, collections, or inventory purchasing.[24]
Phoenix Strategy Group helps growth-stage companies build 13-week cash forecasts, integrated models, and working-capital governance.[21][24]
A widely cited U.S. Bank study found that 82% of business failures involve poor cash flow management or poor understanding of cash flow, which is a strong reminder that working-capital control matters more than headline growth.[19][20]
Once the cause is clear, the job is to line up cash forecasts, collections, inventory, and financing before the next growth push. Then put controls around those inputs so growth doesn’t outrun cash again.
When the dashboard starts flashing red, the move is simple: slow cash going out and get cash coming in faster.
Overtrading isn't just fast sales. It's sales moving faster than cash.
A rolling 13-week cash forecast helps you track weekly inflows, outflows, and ending cash. Use it to pressure-test hiring, inventory, and financing choices before cash drops. If you're about to approve new hires or place a big inventory order, put those costs into the model first and check when cash falls below your minimum cash floor.
That matters because many small businesses don't have much room to miss. The JPMorgan Chase Institute found that the median U.S. small business holds only 27 days of cash buffer [22]. When growth picks up, that margin can disappear fast.
Update the forecast every week with actuals, variances, and a new 13-week view. Done right, it becomes an early warning signal, not just a spreadsheet.
If the forecast shows a gap, go straight to the working-capital levers behind it.
Start with collections. Invoice on delivery, offer ACH and card payments, automate reminders, and track DSO each week. It also helps to tie part of sales compensation to whether customers pay on time, not just whether the deal closes.
Then look at inventory. Set target days on hand by SKU tier, put limits on slow-moving items, and make smaller first buys when entering new markets or adding products. The cash forecast should show exactly how each purchase changes liquidity.
On payables, talk with key suppliers about longer terms. Moving from net 30 to net 45 or net 60 gives you more time before cash leaves the business. Even an extra 10-15 days to DPO, while keeping DSO flat, can cut cash-crunch risk during expansion [4][26].
If changes in operations don't close the gap, the next step is finance support and the right type of funding.
When cash swings get larger, FP&A and fractional CFO support move from nice-to-have to necessary. The goal is to keep growth funded before cash pressure forces you to hit the brakes.
FP&A brings forward-looking modeling, including scenario analysis, budgeting, unit economics, and sensitivity analysis. That lets you test expansion plans against cash limits before you commit.
A fractional CFO guide explains how this role adds oversight at a higher level: capital structure decisions, lender negotiations, board reporting, and governance.
Phoenix Strategy Group works with growth-stage companies on bookkeeping, FP&A, fractional CFO, data engineering, and M&A support, including 13-week cash forecasting and working-capital controls.
The warning signs all lead back to one issue: overtrading is a working-capital mismatch. Sales climb, but cash doesn't land fast enough. That means a company can hit its revenue goals and still run short on cash.
And this isn't some edge case. Poor cash management is linked to most business failures, and many small businesses have only about 27 days of cash buffer [22].
Once you can see the gap, the next move is plain: tight cash discipline. Track DSO, DIO, DPO, and weekly cash balances so problems show up early. Update a 13-week cash forecast every week. Then line up hiring, inventory, and spending with what your cash can support.
Cash discipline isn't just about staying safe. It's a growth skill. The companies that scale well are the ones that turn sales into cash fast enough to pay for the next stage.
If growth is speeding up and your financial visibility isn't keeping up, that's the first gap to close. For support with cash forecasting and working-capital planning, Phoenix Strategy Group provides bookkeeping, fractional CFO, and FP&A support.
Overtrading happens when sales grow faster than your working capital can handle. The result is a cash shortfall. Healthy growth works differently: you have enough liquidity to cover the gap between day-to-day spending and the moment revenue hits your account.
You may be overtrading if revenue looks strong on paper, but cash still feels tight. Maybe payroll is hard to fund. Maybe vendor bills pile up. Maybe routine expenses start to feel harder to cover than they should. That strain often shows up in a few familiar places: rising accounts receivable, too much inventory, or payment terms that don’t line up and leave cash stuck for too long.
The first metric to check is Days Sales Outstanding (DSO). It shows the average number of days it takes to collect payment after a sale.
If DSO starts to climb, more cash stays tied up in receivables for longer. That shrinks your liquidity buffer and can signal that sales growth is moving faster than cash collection. Check DSO every week alongside your other core liquidity metrics.
A growing company should build a 13-week cash forecast as a standard part of managing liquidity risk, spotting cash shortfalls early, and keeping growth on solid financial footing.
This forecast should work as a rolling model and get updated every week. That way, management can see gaps early and adjust spending or collections before a timing issue turns into a full-blown crisis.



