Published on
August 13, 2026


Value creation starts on Day 1, not at sale. If I had to boil this guide down, I’d say this: set a clean baseline, pick 3 to 5 drivers that matter most, assign one owner to each, run a 100-day plan, and build finance and reporting early enough that exit prep is already in motion.
Here’s the core idea in plain English:
A few numbers from the guide stand out:
If you want the short version, this guide is about building a company that can answer four questions at any time: What happened? Why? What happens next? What are we doing about it? That’s the system that supports growth now and a cleaner sale later.
Most diligence reports end up as static documents. That's a miss.
The better move is to turn every finding into an operating roadmap. For each issue, assign:
And build at least 80% of the 100-day plan before close, while the data room is still open.[1][6][7]
A solid handoff should also split confirmed findings from assumptions that still need testing in the first 30 to 90 days. That way, the team can update the plan once live operating data starts coming in.
Use diligence to set the Day 0 baseline.
That baseline should cover more than the main financials. It should also include EBITDA normalized for one-time items, accounts receivable and accounts payable aging, headcount by function, and key system limits such as CRM, ERP, or billing gaps.
Build this at the cohort or segment level whenever you can. Averages can blur what's actually going on. Margin leakage in one customer segment or weak collections in one sales channel can vanish inside a company-wide number.
The point is simple: create a Day 0 measure the team trusts. Then later gains can be tied to actual execution, not accounting noise or cleanup work. This Day 0 view becomes the measurement standard for the 100-day plan and for board reporting.
Next to the baseline, build the status quo case. This is the expected financial and operating path if management makes no major changes after close.
That matters because it separates actual value creation from market tailwinds. It also keeps the team from giving the plan credit for gains that would've happened anyway. Model the status quo using recent trends, renewals, pipeline conversion, attrition, and scheduled cost changes.
Focus first on the findings that move enterprise value the fastest, can be executed soon, and show measurable results.
Across more than 10,000 global PE investments, revenue growth accounts for roughly 54% of total value creation, multiple expansion for 32%, and margin improvement for 14%.[2][3][4][5] That split should shape where the team puts its time early on.
In growth-stage companies, common early wins include reducing discounting, tightening credit terms, fixing billing accuracy, and addressing customer-level margin leakage. These moves can improve cash and margin without a major shift in strategy.
Longer-range initiatives like ERP implementation or a full go-to-market redesign still belong in the plan. But they usually come after the quick-win workstreams, unless they're blocking everything else.
Each finding should turn into one workstream with one owner and one KPI set. Not a committee. One person owns the result, a small group does the work, and everyone else stays informed.
Here’s what that can look like:
| Diligence Finding | Value Driver | Initiative | Accountable Owner | Leading KPI | Lagging KPI |
|---|---|---|---|---|---|
| High discounting in enterprise deals | Pricing discipline | Implement discount approval matrix and price floors | Chief Revenue Officer | Average discount rate | Gross margin |
| Slow cash collections | Working capital | Launch weekly AR review and dunning cadence | Controller | Invoices touched within 5 days | Days sales outstanding |
| Inconsistent reporting | Management visibility | Standardize close calendar and KPI definitions | CFO | Days to close | Forecast accuracy |
| Labor costs above benchmark | EBITDA margin | Operational efficiency and automation review | COO | Labor as % of revenue | Adjusted EBITDA |
| Customer concentration risk | Revenue quality | Diversification and renewal playbook | VP of Sales | Top-10 customer retention rate | Net revenue retention |
Once the workstreams are set, line them up across the first 100 days. Start with cash, reporting, and accountability.
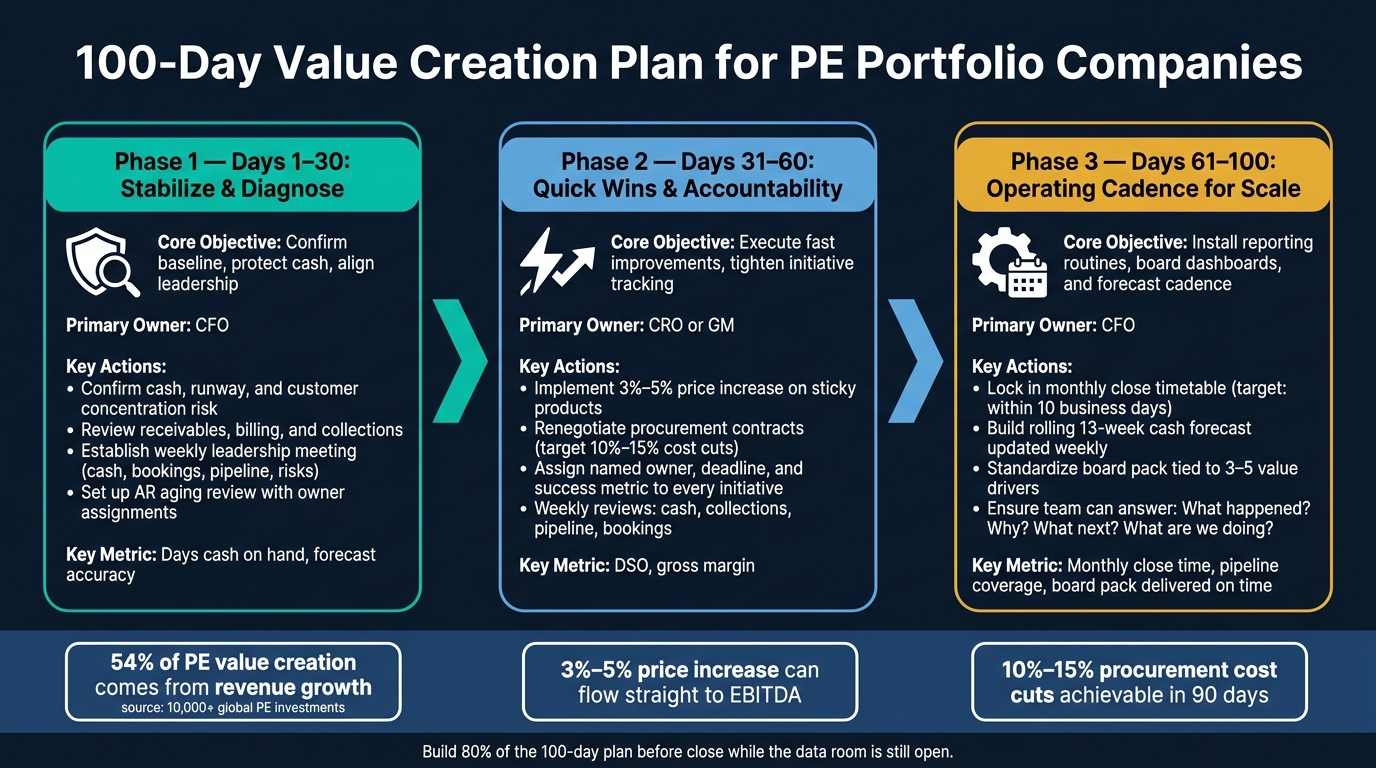
100-Day Value Creation Plan for PE Portfolio Companies
The 100-day plan takes what came out of diligence and turns it into action. The job is pretty simple on paper: protect cash, confirm the baseline, grab quick wins, and put a repeatable operating rhythm in place. Start with the baseline and workstreams already set during diligence.
Keep the plan tight. 4 to 5 SMART initiatives is enough, as long as each one has a named owner and a clear deadline.[8]
The first 30 days are about getting control and cutting surprises. Confirm cash, runway, customer concentration risk, receivables, billing, collections, forecast accuracy, and the top 3 to 5 priorities. Then run a weekly leadership meeting with a fixed agenda: cash, bookings, collections, pipeline, and major risks.[9][10][11]
If collections are uneven, set up a weekly AR review. Keep it simple: aging buckets, owner assignments, and follow-up dates. If the forecast can’t be trusted, the finance lead should reconcile each assumption against actuals and call out the biggest variance drivers.
By Day 30, the team should have a fact base people trust and a short list of clear priorities.
This is usually where quick wins show up. Pricing, collections, spend approvals, procurement, and pipeline discipline tend to move first. A focused 3% to 5% increase on sticky or differentiated products can flow straight to EBITDA with little attrition. Procurement renegotiations can also produce 10% to 15% cost cuts on key contracts within 90 days.[6]
This phase also puts pressure on accountability. Every initiative needs:
A basic tracker is enough. Use columns for workstream, owner, milestone, due date, status, issue, and next step. Assign one owner per workstream: CFO for cash, Finance Ops for collections, CRO or GM for pricing, and Finance for reporting cadence.
Weekly reviews should stay focused on near-term cash and execution risk: cash, collections, pipeline, bookings, customer escalations, staffing constraints, and initiative status. Monthly reviews should focus on trend lines like revenue, gross margin, EBITDA, and forecast accuracy. Keeping those two rhythms separate helps leadership avoid reacting to every short-term bump while still spotting material issues early.
The last 40 days are about moving from ad hoc problem-solving to a stable operating system. That means locking in a monthly close timetable, a recurring forecast update process, a standard board pack, and a dashboard that shows both lagging results and leading indicators.[9][10]
By Day 100, the team should be able to answer four questions without asking for extra approval: What happened? Why? What happens next? What are we doing about it?
The table below shows how each phase maps to a clear objective, owner, and metric:
| Phase | Time Window | Core Objective | Primary Owner | Key Metric |
|---|---|---|---|---|
| Stabilize & Diagnose | Days 1–30 | Confirm baseline, protect cash, align leadership | CFO | Days cash on hand, forecast accuracy |
| Quick Wins & Accountability | Days 31–60 | Execute fast improvements, tighten initiative tracking | CRO or GM | DSO, gross margin |
| Operating Cadence for Scale | Days 61–100 | Install reporting routines, board dashboards, and forecast cadence | CFO | Monthly close time, pipeline coverage, board pack delivered on time |
Once that cadence is running, bake finance, board reporting, and unit economics into the same rhythm.
Once the 100-day plan is in motion, finance, reporting, cash control, and unit economics need to work together. This is the control layer that helps the first 100 days hold up over time.
Finance usually grows in stages: bookkeeping, controller oversight, FP&A, and then CFO leadership [21][23][24].
At this point, the basics need to be tight. Move to accrual accounting, use a standard chart of accounts, and close the books each month within 10 business days. That close should include reconciliations, revenue recognition, payroll accruals, balance-sheet review, and variance notes [20][22][24].
A lot of growth-stage companies fill the gap with outsourced bookkeeping and fractional CFO support until hiring a full in-house team makes sense. Phoenix Strategy Group provides bookkeeping, fractional CFO services, and FP&A support to help companies build investor-grade financials without the overhead of a full internal finance team.
When the monthly close is dependable, those same numbers should feed straight into the board deck.
A good board deck answers three things fast: Are we on plan? Where are we off? What decisions need to happen now? Keep it focused on the calls the board actually has to make [22][24][27][30].
The simplest approach is to use the same 3 to 5 value drivers from the operating plan as the board scorecard. In practice, that usually means:
Each chart should show at least 6 to 12 months of trend data. Then add 1 to 3 bullets that explain what happened and what management will do next. Send the deck 2 to 3 days before the meeting so directors show up ready to decide, not just skim slides [28].
The next piece is cash control. That’s what keeps the numbers on the page tied to what’s happening in the bank.
Your cash forecast should show starting cash, expected receipts, and all disbursements - payroll, vendor payments, rent, and debt service - week by week in a rolling 13-week view that gets updated every week. The point is simple: spot the lowest cash point before you hit it [25][26][29].
Run a weekly cash meeting with the CFO, Controller or bookkeeper, and the functional leads who affect cash. Review actuals against forecast, explain variances, and approve the next round of payments. Set firm approval rules too: any non-payroll disbursement above $10,000 needs CFO sign-off, and vendor contracts above $50,000 need CEO approval [25][26][29].
You also need to track the unit economics behind those same value drivers by cohort. The main metrics are LTV:CAC, CAC payback, burn multiple, and net dollar retention [12][15][16][17]. For SaaS companies, common benchmarks point to LTV:CAC of at least 3:1, CAC payback under 12 to 18 months, burn multiple under 2.0x, and net dollar retention above 110% to 120%+ [12][14][15][16][18][19].
| Metric | Strong | Healthy | Weak |
|---|---|---|---|
| LTV:CAC ratio | ≥ 3:1 | 2:1–3:1 | < 2:1 |
| CAC payback period | < 12 months | 12–18 months | > 24 months |
| Burn multiple | < 1.0x | 1.0x–1.5x | > 2.0x |
| Net dollar retention | > 120% | 110%–120% | < 100% |
| Monthly budget view | 13-week cash forecast | |
|---|---|---|
| Time horizon | 12 months or full year | 13 weeks, rolling weekly |
| Main purpose | Plan and compare performance | Control liquidity and near-term payment timing |
| Update cadence | Monthly | Weekly |
| Best for | Annual planning, variance analysis, board strategy | Cash preservation, disbursement timing, collections management |
| Output | Budget vs. actuals, trend analysis | Ending cash, lowest cash point, weekly variance review |
Don’t stop at company-wide averages. Break unit economics out by customer cohort, product line, and acquisition channel. For example, a company might see that enterprise customers won through outbound sales come with higher CAC, but much better LTV and retention than SMB customers from paid ads. If you only look at top-line averages, you miss that - and that can lead to the wrong investment call [13][15][16].
These metrics later become proof points in diligence.
Exit readiness isn't something you bolt on at the end. It needs to run in the background from day one as part of the value creation plan.
That work shows up later in the sale process. The reporting discipline, cash control, and unit-economics tracking you put in place early become the materials buyers dig through during diligence.
An EY private equity exit readiness study found that when exit prep starts 12–24 months before a sale, about 50% of respondents said it improved exit results, with valuation standing out in particular.[39] An Accordion survey found 81% of sponsors want exit prep to begin at least 12–24 months before sale.[40]
The easiest way to think about this is to work backward from the sale process:
| Phase | Timing Before Sale | Focus |
|---|---|---|
| Foundation | 2–4 Years | Financial reporting clean-up, internal controls, baseline clarity |
| Optimization | 12–24 Months | EBITDA growth, KPI tracking, operational refinement |
| Readiness | 6–12 Months | Quality of Earnings (QoE), due diligence prep, banker engagement |
| Transaction | 0–6 Months | Deal execution and closing |
Adjusted EBITDA support is usually one of the first pressure points. Buyers want a clean bridge from reported net income to adjusted EBITDA. Every add-back needs support in dollars, whether that's one-time restructuring charges, non-recurring advisory fees, or above-market founder compensation. If that backup isn't there, buyers tend to haircut the number or step away.[31][33]
GAAP-compliant financials matter just as much. That means written ASC 606 policies, a monthly close calendar, and reconciled ledgers. Put simply, buyers want numbers they can trust. Roughly one in three signed letters of intent never make it to closing, and quality-of-earnings plus financial diligence issues drive nearly half of all failed transactions.[35][38]
Clean financials aren't enough if the legal record and data room tell a different story. Data-room hygiene means setting up a virtual data room structure 12–24 months in advance, even if no sale process is live yet.[32][33] In practice, that includes:
Buyers also look past headline growth. They want to know whether that growth will hold up under scrutiny. That's where revenue and customer quality metrics come in. Net revenue retention by cohort, customer concentration by account, and unit economics by channel help show whether valuation rests on solid footing during diligence.
For example, a growth-stage U.S. SaaS company that can show its 2024 customer cohort has 115% net revenue retention, no single client representing more than 7% of ARR, and a direct-sales LTV:CAC of 4.0x with a 12-month payback period tells a much stronger story than a company that can only point to total ARR.[32][33] Phoenix Strategy Group supports this through FP&A and data engineering so those metrics are ready well before a buyer asks.
Working capital discipline matters here too. A Grant Thornton survey of 189 U.S. M&A professionals found that 46% of deals involved working capital disputes.[34][36][37] Keeping DSO tight and holding net working capital within a predictable range relative to revenue can lower the odds of post-close purchase price adjustments.
Each part of this process builds on the one before it. Diligence findings set the baseline. The baseline shapes the 100-day plan. The 100-day plan puts in place the finance function, reporting rhythm, cash controls, and unit-economics tracking that later support a defendable exit story.
Run that system with discipline from close onward, and exit readiness becomes part of how the business operates.
Focus on the transitions, decisions, and day-to-day events most likely to change results in a big way. Start with the stages in your business lifecycle where winning or losing would have the biggest effect on your path.
Put the most weight on drivers that protect value, cut risk, or show that the business can scale. Each one should connect straight to unit economics and long-term financial health. They also need to be measurable, backed by data, and in line with your growth goals.
A Day 0 baseline sets the company’s starting financial and operating position before growth or integration begins.
It should include the opening cash balance, three to five years of audited financials, tax returns, key contracts, and validated core metrics like ARR, MRR, CAC payback, and burn pulled from billing, CRM, and general ledger data.
Exit prep should begin years before a deal is on the table. Most companies hit the final readiness stretch in the 6 to 12 months before a sale. But the hard work starts long before that.
Teams often tackle financial cleanup and internal controls 2 to 4 years in advance. After that, they usually spend 12 to 24 months improving EBITDA and key KPIs. That lead time matters. It gives the business room to make operational changes that stick and run sell-side due diligence before buyers start digging in.



