Published on
August 28, 2026


If your finance team still builds board packs by hand, you're losing time and risking stale numbers. I’d use Power BI to connect ERP, accounting, budget, cash, and forecast data into one reporting setup built for five jobs: board reporting, monthly close, KPI tracking, cash flow, and forecasting.
Here’s the short version:
Power BI works best when finance treats it like a reporting system, not just a dashboard tool. That means clean source data, shared metric definitions, tight close checks, and reports built for the people who use them.
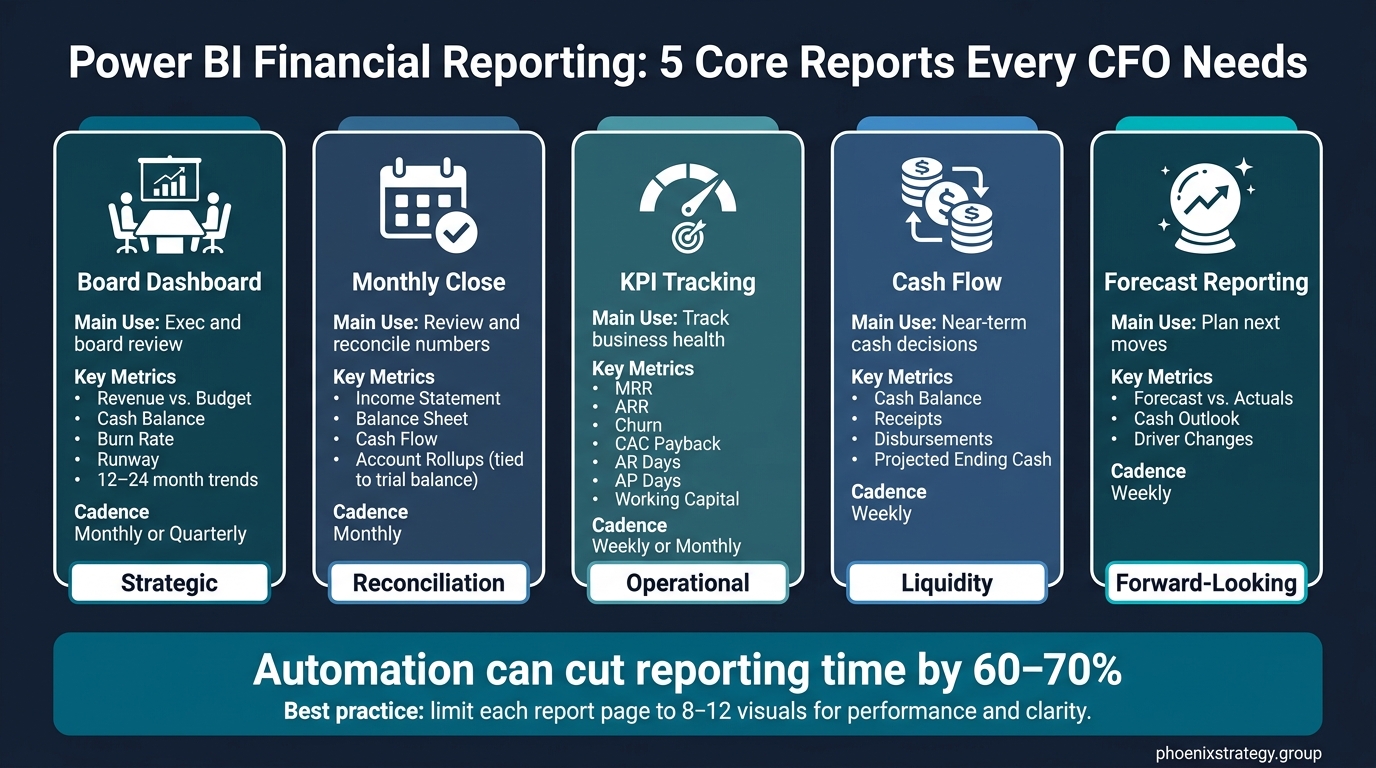
Power BI Financial Reports for CFOs: Types, Metrics & Cadence
| Report type | Main use | What I’d show | Usual cadence |
|---|---|---|---|
| Board dashboard | Exec and board review | Revenue vs. Budget, Cash Balance, Burn, Runway, 12–24 month trends | Monthly or quarterly |
| Monthly close | Review and reconcile numbers | Income Statement, Balance Sheet, Cash Flow, account rollups | Monthly |
| KPI tracking | Track business health | MRR, ARR, churn, CAC payback, AR days, AP days, working capital | Weekly or monthly |
| Cash flow | Near-term cash decisions | Cash balance, receipts, disbursements, ending cash | Weekly |
| Forecast reporting | Plan next moves | Forecast vs. actuals, cash outlook, driver changes | Weekly |
If I were setting this up, I’d keep one rule in mind: the report should help me make a decision fast.
Start with the decisions a fractional CFO needs to make. Then pick the data that helps answer those questions.
For board reporting and monthly close views, begin with actuals vs. budget data. That way, variance analysis is baked into the model from day one. For KPI tracking, define each metric upfront, including its trend, target, and comparison period [2].
Those inputs support the board, close, cash, and forecast views covered next.
Build the model around CFO decisions, not chart types. That sounds simple, but it changes everything.
Use consistent definitions for actuals, budget, forecast, time, entity, department, and account. If those definitions are set at the model level, every report built on top stays in sync. That means fewer debates over what a number means and more time spent acting on it.
As reporting expands, performance turns into a design limit. This tends to show up faster as entity count grows, transaction volume increases, and reporting frequency picks up.
Keep pages to 8–12 visuals. More clutter slows both review and performance [2]. Use filtering and model design to keep high-cardinality data responsive as the business grows [2].
That setup shapes how well the core finance reports handle scale. With the foundation in place, the next step is building the board, close, cash, and forecast pages CFOs rely on most.
Once the data model and refresh rules are set, the next job is the report layout CFOs use day to day. Building on the finance-ready model, the board page should turn the main numbers into a fast-read summary that helps founders explain performance in a clear, direct way.
Put Revenue vs. Budget, Cash Balance, Burn, and Runway at the top of the page. Keep the visual order simple: headline metrics first, trend lines second, drill-throughs last.
Those headline numbers should be backed by 12- to 24-month trend lines so the board can see direction, not just a point-in-time view.[2] Then add drill-throughs for entity-level or department-level detail.
From that summary view, the close pack should give finance the detail needed to check the numbers. It should mirror the statements teams already know: an Income Statement, Balance Sheet, and Cash Flow, built with account hierarchies and subtotals that reconcile to the trial balance. That setup keeps the close report consistent and easier to review.
The KPI page should sit next to the financial statements and track the metrics leadership looks at most often: MRR, ARR, churn, CAC payback, AR days, AP days, and working capital.[2]
For day-to-day decisions, the same model should also support a cash view. The cash and forecast page should show current cash balance, receipts and disbursements, and projected ending cash.
Each page should match its audience and reporting rhythm:
Once the core reports are in place, the next challenge is scale: performance, control, and clear ownership.
As companies grow, Power BI reporting problems usually show up in familiar ways [1]. Multi-entity reporting can surface consolidation issues and duplicate report versions. When a company adds entities or starts rolling up results across business units, intercompany eliminations get harder to manage. At the same time, different teams often build their own versions of the same report.
That’s where a standard template and a simple approval process for new reports can help keep the reporting suite aligned [2].
Weak ownership is another common problem. Each KPI should have a named owner who is responsible for accuracy and interpretation [1].
Controls matter just as much as speed.
Power BI reports need to tie back to the close process. Use role-based access so board, finance, and department users each see the right view. Before a board review, reconcile the Power BI income statement to the ERP trial balance. That one step can help avoid the kind of number mismatch that throws a meeting off track [1].
It also helps to make close progress visible. For example, track month-end close status as a KPI, including days elapsed against the target close date. When the reporting calendar is visible, accountability tends to follow [1].
At a certain point, reporting demands can outrun what an internal team can reasonably handle [1]. This often happens when the business needs multi-entity consolidation, intercompany eliminations, or integrated FP&A models. The same thing can happen when a company is getting ready for a funding round or an M&A process and needs cleaner data pipelines and tighter board reporting [1].
Phoenix Strategy Group helps growth-stage teams connect bookkeeping, fractional CFO support, FP&A, and data engineering when reporting outgrows the internal team.
Reliable Power BI reporting starts with clean data, a finance-ready model, focused reports, and clear rules around ownership and access. Each report should tie back to one of five finance decisions: board prep, monthly close, KPI review, cash flow, or forecasting.
Start with source data you can trust, then map it into an actuals-budget-forecast model. After that, build reports around the decisions they need to support. Good design should serve the decision, not the dashboard.
When the base, core reports, and controls are set up well, Power BI can become finance’s day-to-day operating system. Align refreshes with the close cycle, limit access by role, and reconcile reports to the ERP or trial balance before board review.
If reporting starts to outgrow what the internal team can handle, Phoenix Strategy Group (phoenixstrategy.group) helps growth-stage companies bring bookkeeping, fractional CFO support, FP&A, data engineering, and M&A support into one reporting system.
Start by defining 5–10 KPIs. Give each one:
Then document them in a metric playbook.
After that, connect reliable data sources with automated refresh, standardize and clean the data, and shape it for performance.
Finish with governance:
Start with a cash-and-runway view at the top. Use KPI tiles for the current cash balance, burn rate - gross and/or net - and runway in months, so cash risk is easy to spot at a glance.
Then add simple trend context, with clear threshold coloring for safe, watch, and risk. Include revenue and margin context so the cash picture doesn’t sit on its own. Place P&L budget vs. actual and forecast vs. variance below.
Treat the monthly close as the foundation of clean reporting. Use accrual-based bookkeeping, then reconcile your billing platform, CRM, and general ledger in Power BI before you finalize any report.
That way, the numbers in your dashboard line up with the numbers finance trusts. No surprises. No last-minute scrambling.
A few things help make that process stick:
This setup keeps reporting grounded in the monthly close instead of turning it into a separate system with its own version of the truth.