Published on
July 22, 2026


If your ERP data is clean, six KPIs can tell you where a SaaS business is heading before the quarter ends.
I’d boil the article down to this: if I want a forecast I can trust, I need to track MRR growth, churn trend, CAC payback, GRR, NRR, and cash burn from one reconciled ERP dataset. Those six numbers help me answer four basic questions: Are we growing? Are customers staying? Is acquisition paying back? Do we have enough cash?
Here’s the short version:
A few numbers stand out:
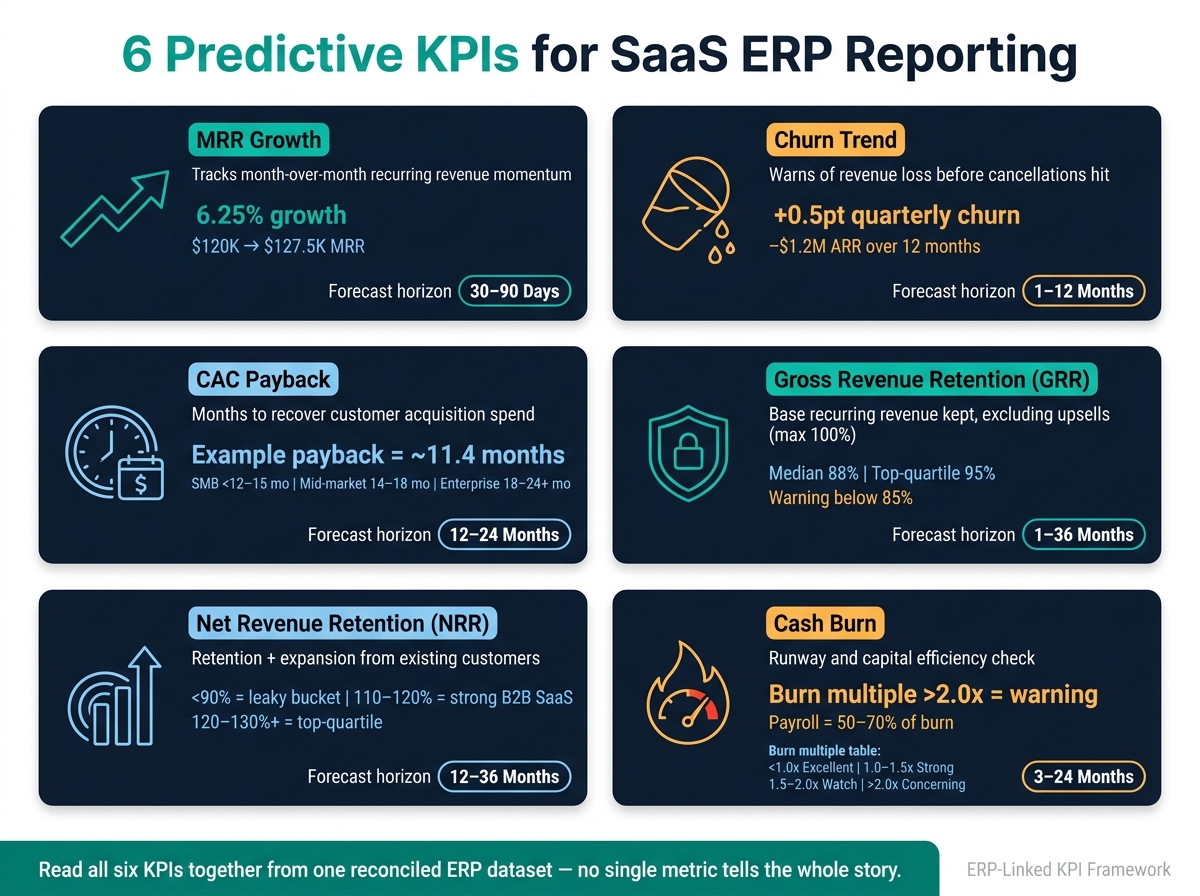
6 Predictive KPIs for SaaS ERP Reporting: At-a-Glance Guide
| KPI | What it forecasts | Main ERP inputs | What I watch for |
|---|---|---|---|
| MRR Growth | Near-term revenue pace | Contracts, billing, revenue schedules, AR | Sales momentum vs. billing delays |
| Churn Trend | Revenue loss risk | Renewals, cancellations, dunning, past-due invoices | Early retention problems |
| CAC Payback | Sales efficiency | GL, payroll, commissions, AP, customer revenue | Whether growth spend pays back |
| GRR | Base revenue retention | Downgrades, cancellations, recurring revenue by cohort | Revenue stickiness |
| NRR | Expansion plus retention | Expansion, contraction, churn, plan changes | Whether the base is compounding |
| Cash Burn | Liquidity and runway | Cash, AP, AR, payroll, bank recs | How long cash lasts |
The main point is simple: one KPI alone can mislead you. MRR can look fine while churn gets worse. NRR can look high if a few big accounts do most of the expansion. Cash burn can show runway, but not whether growth quality is good. That’s why I’d read all six together, using one customer ID, clean revenue recognition, and clear cost tagging across ERP, CRM, and BI.
Monthly Recurring Revenue (MRR) growth tracks the month-over-month change in recurring subscription revenue, converted into a monthly number. If MRR moves from $120,000 to $127,500, that’s a 6.25% gain. Simple on the surface, but it tells you a lot. It gives an early read on sales efficiency, retention, and expansion.
In ERP reporting, MRR is often the first check on revenue momentum. It works best for 30–90 day and quarterly forecasting, especially when you're looking at the next quarter up to 12 months for near-term operations and planning.[7][9] That’s why boards and fractional CFOs often look at month-over-month and quarter-over-quarter MRR growth side by side. One shows the immediate pace. The other helps smooth out short-term noise.
Pull MRR data from subscription contracts, billing schedules, revenue recognition entries, accounts receivable aging, and deferred revenue schedules.[2][3][4] These records show when MRR begins, when renewals are getting close, and when revenue hits the books.
One thing matters a lot here: keep one-time fees and services revenue separate in your ERP setup. If you mix them into MRR, the number gets inflated and stops telling the truth.[5][6][8]
If bookings are growing faster than recognized MRR, ERP is showing a lag between the sale and the revenue showing up. That usually points to a conversion or implementation issue, not a demand problem.
In plain terms, the deals are there. They just aren’t turning into billable, recognized revenue fast enough. ERP makes that gap hard to miss because you can see it in billing and collections.
Stronger models break MRR into four drivers:
From there, apply separate scenario assumptions to each one. That’s where the forecast gets more useful.
The model gets harder when you add usage-based billing, multi-currency contracts, or mid-term amendments. In those cases, don’t rely on one top-line MRR number. Track signed-but-not-billed MRR, active subscriptions, and expected renewals separately. That way, leadership can see what’s actually pushing next quarter’s growth instead of guessing from a blended figure.
MRR shows the growth path; churn trend shows whether it will hold.
Churn trend shows the direction of customer or revenue loss over time. Put simply, it tells you whether growth is sticking or slipping away. You can track it in three ways: logo churn (accounts lost), revenue churn (recurring dollars lost), and cohort churn (how certain customer groups behave over time).
Of those three, revenue churn is often the one that gives finance the clearest signal. One lost customer might barely move the needle. Another can leave a big hole in ARR. When you pair churn with MRR growth, you get a clearer read on whether new revenue is beating the revenue that's leaving. And when ERP data is set up well, churn stops being just a look back at what happened and starts acting more like an early warning system.
A 1–3 month forecast is usually the most accurate because it leans on renewals and cancellations that are already known in the ERP.
A 6–12 month view is more useful for budgeting, board ARR guidance, and scenario planning.
Once you get past 18–24 months, churn forecasts become more directional. At that point, they're best for big-picture planning, like fundraising and hiring.
The best churn signals usually come from ERP fields that track the full subscription lifecycle: contract start and end dates, renewal terms, cancellation events, downgrade records, past-due invoices, dunning history, and deferred revenue movements.[10][11][12]
One signal stands out more than most: late payments. Rising late payments, partial payments, or heavier credit memo usage often show up in ERP data 30–90 days before a customer actually cancels.[14][15] That's the kind of pattern finance teams can't afford to miss.
Once those signals live in the ERP, finance, often supported by fractional CFO services, can measure the downstream effect in dollars. A 0.5 percentage point increase in quarterly revenue churn can cut projected ARR by $1.2 million over the next 12 months and stretch CAC payback from 14 to 17 months.[14][15]
That’s why leadership dashboards should show churn trend against clear targets. If the team is off pace, the gap should be obvious at a glance.
According to 2025 B2B SaaS benchmarks from Lighter Capital, median revenue churn rose from 11.34% in 2024 to 12.50% in 2025, while the top-performing 25th percentile improved from 6.07% to 5.48%.[13]
For early-stage companies, a rolling average of the last 6–12 months of ERP-derived churn rates is a solid starting point. It’s simple, and it gives you a baseline you can work from.
But don’t stop at one company-wide number. Break churn out by segment, term, and acquisition channel. A single blended rate can hide what’s actually going wrong.
CAC payback shows how many months it takes for gross profit from a new customer to earn back what you spent to get that customer. A standard formula is: CAC payback = sales and marketing cost to acquire new customers ÷ monthly gross profit from those customers.[21][24][1]
Here’s a simple example. Say your ERP shows $1.2 million in Q1 2026 acquisition-related sales and marketing spend, 300 new customers, $500 MRR per customer, and a 70% gross margin. In that case, CAC payback comes out to about 11.4 months.
A 12-month horizon is a good fit for near-term tracking and go-to-market decisions. It helps you see whether customer acquisition is paying back at a pace your business can support.
An 18–24 month view makes more sense for scenario planning. That’s especially useful when you’re testing changes to pricing, sales headcount, or marketing mix.
CAC payback depends on ERP-linked spend, margin, and customer data. The main inputs usually include:
Those inputs should connect to CRM closed-won data through a single customer ID. Without that link, you end up blending all new customers into one average rate. With it, you can assign costs to specific cohorts and get a much clearer read on payback.
Use these ranges as directional targets, not hard rules.[17][18][19][20][22][23][25]
| Segment | Typical CAC Payback Target |
|---|---|
| SMB (< $10K–$15K ACV) | < 12–15 months |
| Mid-market ($15K–$100K ACV) | 14–18 months |
| Enterprise (> $100K ACV) | 18–24+ months |
| Series B+ / scale (> $10M ARR) | < 12 months |
Longer payback can still be acceptable when GRR and NRR are strong. A company may wait longer to recover acquisition spend if customers stick around and expand over time.
Most teams begin with a simple blended CAC across all customers. That works as a starting point. But it also smooths over a lot of detail.
The next step is cohort-level modeling. That means breaking payback out by acquisition month, channel, and segment, then tying it back to ERP expense allocations and CRM pipeline data.
CAC payback tells you how fast acquisition spend comes back. GRR tells you whether those customers keep paying back that investment.
Gross Revenue Retention (GRR) shows how much starting recurring revenue you keep from current customers, without counting expansion revenue. Since upsells are left out, GRR can never go above 100%.[26][27][29] That makes it a clean way to look at core revenue stickiness - and the floor beneath CAC payback.
Here’s a simple example: if starting MRR is $500,000 and you lose $25,000 from downgrades plus $25,000 from cancellations, your GRR is 90%.
Use a 1–3 month view for cash and headcount planning, 4–12 months for budgeting and board reporting, and 12–36 months for fundraising and M&A scenarios.
Use the ERP to track:
Tag every contraction with a reason code, such as "budget cut", "pricing change", or "product fit." That way, you can see what’s driving a drop in GRR. Is it pricing? A product issue? Trouble collecting payments? This is where the story starts to get clearer.
A practical read on GRR looks like this: 85%–90% is good, 90%+ is strong, and 95%+ is excellent.[28][30][32] The 2025–2026 median is about 88%, while top-quartile companies sit at 95%.[30][31] Enterprise-focused SaaS companies often land near the top end because their contracts tend to be more embedded in day-to-day customer workflows.
If GRR falls below about 85%, that’s a warning sign that churn or contraction may be moving faster than product stickiness.[28][32] And that tends to ripple through the rest of the model. Even if you improve other parts of the business, weak GRR can drag results down because the revenue base is already leaking.
Once GRR is steady, NRR tells you how much expansion revenue is stacking on top of that base.
Start with blended GRR by segment. As ARR grows, move into cohort-level renewal tracking. Go to contract-level survival analysis only when ERP, usage, and support data are clean.
Model GRR first. NRR tells you whether expansion can offset that retention floor.
Net Revenue Retention (NRR), also called Net Dollar Retention (NDR), shows how much recurring revenue you keep from current customers and how much you grow from that same group. If GRR tells you the floor, NRR tells you whether expansion pushes that floor higher.
Here’s the formula:
NRR = (Starting MRR + Expansion − Contraction − Churn) ÷ Starting MRR × 100%[33][34][36]
Let’s make that concrete. Say you start January with $500,000 in existing-customer MRR, add $60,000 in expansion, lose $20,000 from downgrades, and lose $10,000 from cancellations. Your NRR would be 106%.[33][34][36] That extra 6 points means your current customer base is growing even without new logos. That’s why NRR is such a clean read on whether the installed base is compounding or slowly leaking.
For near-term planning, use a 12-month forecast. Once cohort behavior settles down, extend that view to 24–36 months.[33][37][38] It also helps to run base, downside, and upside cases tied to U.S. fiscal periods.
Pull customer and contract IDs, committed ARR/MRR, invoice and credit memo amounts, revenue schedules, and plan codes from the ERP. Then map billing events to revenue schedules so expansion and churn hit the correct month.[33][37][40]
That timing piece matters more than it may seem. If billing activity and revenue timing don’t line up, your NRR forecast can drift away from actual earned revenue.
These ranges give you a fast read on what’s going on:
| NRR Range | What It Signals |
|---|---|
| Below 90% | Leaky bucket - retention or value-gap problems need urgent attention [33][35][36][39] |
| 100% | Breaking even on the existing base; limited compounding [33][35][36][39] |
| 110–120% | Strong for many B2B SaaS companies; supports disciplined growth investment [33][35][36][39] |
| 120–130%+ | Top-quartile; often seen in sticky, usage- or seat-based products [33][35][36][39] |
The number by itself doesn’t tell the whole story. What matters is whether expansion is covering churn - or just hiding it.
For example, a company with 90% GRR and 115% NRR is leaning on expansion to make up for churn.[34][37][38] That’s why NRR and GRR should always be read together, not on their own.[34][37][38]
A good starting point is trailing 12-month NRR applied to future MRR, with adjustments for known changes like a price increase or a customer success program.[33][37][38] From there, segment by customer vintage, size, and product mix, then split NRR into expansion, contraction, and churn.[33][36][37]
That breakdown gives leadership a much clearer view. If NRR improves, is it because customers are staying longer, or because the team is driving more upsell? That answer shapes customer success headcount and sales compensation priorities in a very direct way.[33][37][38]
Cash burn is the last hard check on the model: are growth, retention, and collections paying for the business fast enough? Gross burn is total cash going out, including payroll, software, infrastructure, and marketing. Net burn backs out cash coming in, and that’s the number that sets runway.[45][49][50]
Payroll by itself makes up 50–70% of total burn, so hiring choices have a big effect here.[45] In ERP reporting, burn matters because it connects revenue timing to liquidity. A company can look fine on paper and still run into trouble if cash lands too late.
Model net burn monthly across three time frames:
For months 12–24, use scenario-based projections: base, downside, and upside. That matters because hiring and marketing assumptions get a lot less certain that far out.[44][45]
The main ERP inputs are pretty direct. Headcount plans feed payroll lines. Contracted software feeds recurring vendor spend. Marketing plans tie into expected revenue collection.[45][46]
That should sit on top of reconciled GL cash accounts matched to bank balances, AR collection schedules, and AP due dates with vendor payment terms.[45][46] AP due dates and vendor terms are a big deal here. They shift the model from accrual timing to cash timing, and runway depends on cash timing, not accounting timing.
The two main decision metrics are runway in months and burn multiple.
Runway is cash on hand divided by monthly net burn.[48]
Burn multiple is net burn divided by net new ARR, and it shows cash efficiency.[41][42]
That’s why this metric matters so much: a company can post strong revenue growth and still get squeezed if burn moves faster than collections.
| Burn Multiple | What It Signals |
|---|---|
| Below 1.0x | Excellent capital efficiency at any stage[42][50] |
| 1.0–1.5x | Strong; common target at Series A/B[16][43] |
| 1.5–2.0x | Acceptable but watch closely; often seen in earlier-stage or aggressive-growth companies[16][43] |
| Above 2.0x | Concerning, especially as ARR scales[42][43] |
A simple example shows how this works. At $300,000/month in net burn with 14 months of runway, slowing planned hiring by 30% could stretch runway to 20 months, assuming ARR keeps growing at 4% month over month. That’s the kind of scenario an ERP-linked forecast can show before the board meeting instead of after.
Early-stage companies with sub-$5M ARR can often handle burn modeling with high-level GL exports and a simple monthly cash projection.[47] Once a company reaches the growth stage - roughly $5M–$50M+ ARR - it usually needs driver-based models tied to headcount, software, and marketing spend.[47]
One common problem is over-aggregated GL categories. They hide whether costs are fixed, variable, or discretionary. Tagging spend by department and function fixes that. It also helps to split operating burn from discretionary growth spend, so hiring and investment choices are easier to judge.
ERP turns six KPI snapshots into one driver-based forecast model. That’s where the payoff is. The point isn’t to stare at one metric in isolation. It’s to see how MRR, churn, CAC payback, GRR, NRR, and cash burn move together.
Here’s how each KPI connects to ERP data and the planning calls that follow.
| KPI | Primary ERP Records | Recommended Granularity | Key Planning Questions |
|---|---|---|---|
| MRR Growth | Subscription/contract records, invoice line items, revenue recognition schedules | Customer-by-month or subscription-by-month | Can we add sales headcount? When do we hit the next ARR milestone? |
| Churn Trend | Cancellation dates, contract end dates, downgrade invoices, credit memos | Customer and cohort by month | Do we need more Customer Success? Is churn rising in one segment? |
| CAC Payback | Sales & marketing GL accounts, payroll allocations, new business invoice lines | Monthly by channel or campaign | Scale or cut this channel? Can we add another AE pod? |
| GRR | Starting-period recurring revenue, downgrade amounts, churned contract values | Customer and product family by month/quarter | Is base revenue stable enough for a larger engineering roadmap? |
| NRR | GRR inputs plus expansion/upsell invoice lines and price-increase entries | Customer-level monthly | Prioritize expansion or net-new logos? Can we justify a price increase? |
| Cash Burn | Cash-basis GL, AP/AR subledgers, payroll runs, bank feeds/reconciliation data | Daily or weekly for short-term; monthly for board-level planning | How many months of runway remain? Slow hiring or raise capital? |
Once that mapping is in place, the next move is scenario testing. This is where ERP starts to earn its keep. You can model hiring, pricing, and spend with one ERP-backed dataset instead of stitching together a pile of spreadsheets.
For example, a runway model can pull MRR growth, churn, and NRR into future burn and hiring plans in one pass. A GTM scenario can test how doubling ad spend changes CAC payback and 12–24 month ARR.[51][52]
Data hygiene matters more than most teams expect. Small formatting issues can throw off the whole model. Normalize all amounts to USD. Use MM/DD/YYYY across ERP, CRM, and BI tools. And use one customer ID across AR, revenue recognition, and subscriptions so you don’t double-count customers in churn and NRR math.[53][54]
Phoenix Strategy Group helps growth-stage SaaS companies standardize ERP, FP&A, and data pipelines so leaders can run scenarios without manual spreadsheet consolidation.
Those same data links also expose each KPI’s trade-offs, which is why the next section weighs the pros and cons.
These metrics work best together. Each one answers a different forecasting question, and each one can point you in the wrong direction if you read it by itself. In ERP-linked reporting, no single KPI tells the whole story. Use the table below to connect each KPI to the decision it helps guide.
| KPI | Main Advantages | Main Drawbacks | Best-Use Context |
|---|---|---|---|
| MRR Growth | Direct top-line signal | Can hide churn if new bookings offset losses | Board reporting and headcount planning |
| Churn Trend | Reveals retention dynamics over time; cohort-level data exposes segment risk | Volatile; one-off pricing or promo events can distort it | Renewal modeling and Customer Success investment |
| CAC Payback | Flags capital efficiency problems early | Only as accurate as expense allocation | Channel investment and sales hiring scenarios |
| GRR | Isolates core retention without upsell distortion; can't exceed 100% | Excludes expansion, so it can understate account value | Stress testing and renewal risk assessment |
| NRR | Captures both churn and expansion in one number; strong valuation predictor | Can be skewed by a few large accounts | Growth planning from existing customers and investor reporting |
| Cash Burn | Direct runway signal | Shows runway, not growth quality | Treasury, hiring, and fundraising timing |
A common mistake is treating one strong number as a green light to spend more. That’s where teams get into trouble.
For example, MRR can look healthy while churn is climbing underneath it. New bookings may fill the gap for a while, but the problem is still there.
The same thing happens with NRR. A high number can look great on paper, yet still hide concentration risk if a small handful of large accounts are doing most of the work.
Cash burn needs context too. On its own, it’s just a point-in-time measure. It tells you about runway, not whether growth is sound. That’s why it should be read alongside MRR growth, NRR, and CAC payback.
No single KPI tells the whole story. MRR growth, churn, CAC payback, GRR, NRR, and cash burn make more sense when you look at them together as one operating view.
That view helps with four day-to-day calls: growth, retention, efficiency, and liquidity. But it only works if your ERP data is clean. For U.S. SaaS operators, the most practical place to start is simple: use one customer ID, apply consistent revenue recognition, and keep sales and marketing cost tagging clean. Then build a weekly or monthly dashboard around subscription movement, recognized revenue tied to MRR, CAC spend, and cash burn, all connected through shared customer, product, segment, and period dimensions.
Once that reporting is set up, the dashboard stops being a monthly cleanup project and starts becoming part of how the team runs the business. Growth-stage companies that treat these metrics as a weekly habit tend to move faster, speak with more confidence in investor talks, and spot problems before they snowball. Phoenix Strategy Group helps growth-stage SaaS teams build ERP-linked KPI reporting that supports faster decisions.
Prioritize KPIs based on your company’s stage and near-term goals, but start with MRR as your main measure of business momentum.
Since MRR is a lagging indicator, pair it with NRR and churn rate to keep tabs on customer health and expansion potential. If you want efficient, steady scaling, track CAC payback period and LTV/CAC ratio in your ERP dashboard too.
ERP data needs to be accurate and consistent if predictive reporting is going to work. If the data is incomplete or messy, projections can go off track fast. That’s why automated validation matters. It should help check inputs and confirm that data transformations are correct.
You also want one source of truth. In practice, that means connecting your ERP with your CRM and bank feeds, then keeping everything aligned with a central data dictionary. A metric is only ready for executive use when two people can calculate it on their own and get the same answer.
Use a tiered review schedule based on how fast your data moves.
The key is to keep that schedule steady. When everyone looks at the same numbers at the same cadence, it’s much easier to spot shifts early and stay on track.
It also helps to use automated ERP-integrated dashboards. They keep reporting accurate, audit-ready, and lined up with your growth plan.



