Published on
July 30, 2026


If you don’t model margin below gross sales, you can grow revenue and still lose money. I’d boil this guide down to one idea: track profit from gross sales to EBITDA at the SKU-and-channel level, update it monthly, and watch the few inputs that move profit the most.
Here’s the short version:
A few numbers show why this matters: trade spend often sits at 15%–25% of gross sales, gross-to-net deductions can hit 30%–40%, and some U.S. trade promotions lose money. That means a brand can post sales growth while net revenue and EBITDA get squeezed.
At a basic level, I want my model to answer five questions:
That’s the whole job of the model: turn top-line sales into a plain view of what I keep, where I lose it, and what needs to change.
In the waterfall, net revenue is gross sales minus customer-specific reductions.
Every CPG revenue model starts with wholesale list price and case pack before discounts and deductions. You should model pricing in both per-unit and per-case terms so you can compare pack sizes and SKU margin side by side.
For example, if a 12-unit case sells at $24.00 and a 15% discount applies, realized net revenue comes out to $20.40 per case, or $1.70 per unit.
Trade spend belongs above gross margin as a revenue reduction. It covers customer-specific trade support like promotions and slotting. If you put it in SG&A, gross margin looks higher than it should[1][9].
The line items that should reduce net revenue include promotions, scan allowances, bill-backs, off-invoice discounts, slotting fees, free fills, co-op advertising and marketing fees, damaged goods claims, short-ship deductions, chargebacks, returns, and other customer-level allowances[1][2][8][9][10]. In promotion-heavy categories, these gross-to-net deductions often run 30% to 40% of gross sales, which means net revenue may end up at only 60% to 70% of gross[12].
| Deduction Category | Typical Range (% of Gross Sales) |
|---|---|
| Trade spend (promotions, off-invoice discounts, slotting, scan allowances, co-op) | 15–25% |
| Retailer deductions and chargebacks | 5–15% |
| Distributor deductions (damages, shortages, fees) | 3–7% |
Use those ranges as directional starting points. Actual rates vary by channel and customer[1][2][7][11][12]. That's why each line item should be modeled separately by customer and channel, not rolled into one blended percentage. Trade structures and deduction patterns can look very different across UNFI, KeHE, direct retail accounts, and Amazon[1][2].
Once net revenue is set, build fully loaded COGS to get to gross margin.
Once net revenue is set, the next job is simple in theory and easy to get wrong in practice: put every direct product cost into COGS. If your COGS model misses costs, gross margin will look better on paper than it does in real life.
A fully loaded product cost starts with a costed bill of materials (BOM) for each SKU. That means ingredients, packaging, manufacturing labor or tolling, and inbound freight to your warehouse or 3PL. Put each cost on a per-unit or per-case basis so the math stays clean.
Packaging can be a much bigger piece of COGS than people expect. In many cases, it makes up 20–35% of COGS.[18] For example, a beverage SKU might break down like this: $0.62 in ingredients, $0.38 for a glass bottle and cap, $0.08 for a label, $0.14 in case pack components, and $0.45 in co-man tolling. That adds up to $1.67 per unit before freight.[17]
You also need to account for production minimums and scrap. A flat run fee spread across fewer units pushes unit cost up. And if scrap runs at 3%, divide total cost by 0.97 to get the actual unit cost.[13][19]
Inbound freight should be assigned per case using actual lane costs. Say a $1,200 truckload carries 780 cases. That comes out to about $1.54 per case, or roughly $0.13 per unit for a 12-count pack. This number shouldn’t stay static. If fuel surcharges move or carrier rates change, update it. Long-haul freight from a faraway co-packer can squeeze margin without much warning.[6][13]
After direct costs, split production overhead from corporate overhead. That keeps gross margin comparable across SKUs instead of turning it into a mixed bucket of product and company costs.
Include overhead tied to production volume in product cost. That usually covers:
Keep company overhead in SG&A. That includes executive salaries, finance and HR, corporate rent, sales and marketing, and R&D that isn’t tied to a specific production run.
One warning here: if you change your allocation method halfway through, your gross margin trend line stops being useful. Pick one method, write it down, and review it once a year or when the business hits a major scale shift.
Brand-level averages can hide a lot. A 40% brand average may still include SKUs sitting at 20% or less.[5][14] That’s why SKU-level margin matters, especially when pack size, ingredient mix, or handling needs differ across the line.[5][15][16]
Use the SKU-level formula: (Net Revenue − COGS) ÷ Net Revenue.[6][20] Build that view first, then roll it up to the brand level. Doing it in that order helps low-margin items stand out instead of getting buried in the average.
That SKU-level gross margin is the starting point for the next layer of analysis: channel freight, returns, and variable selling costs. Once those are added, you move from gross margin to contribution margin.
CPG Profit Margin Waterfall: Gross Sales to EBITDA by Channel
Once SKU gross margin is in place, the next move is to test what each channel does to actual profit. Gross margin stops at the product itself. Contribution margin goes one step further and shows what each channel leaves behind after fulfillment costs. That’s where the math starts to split.
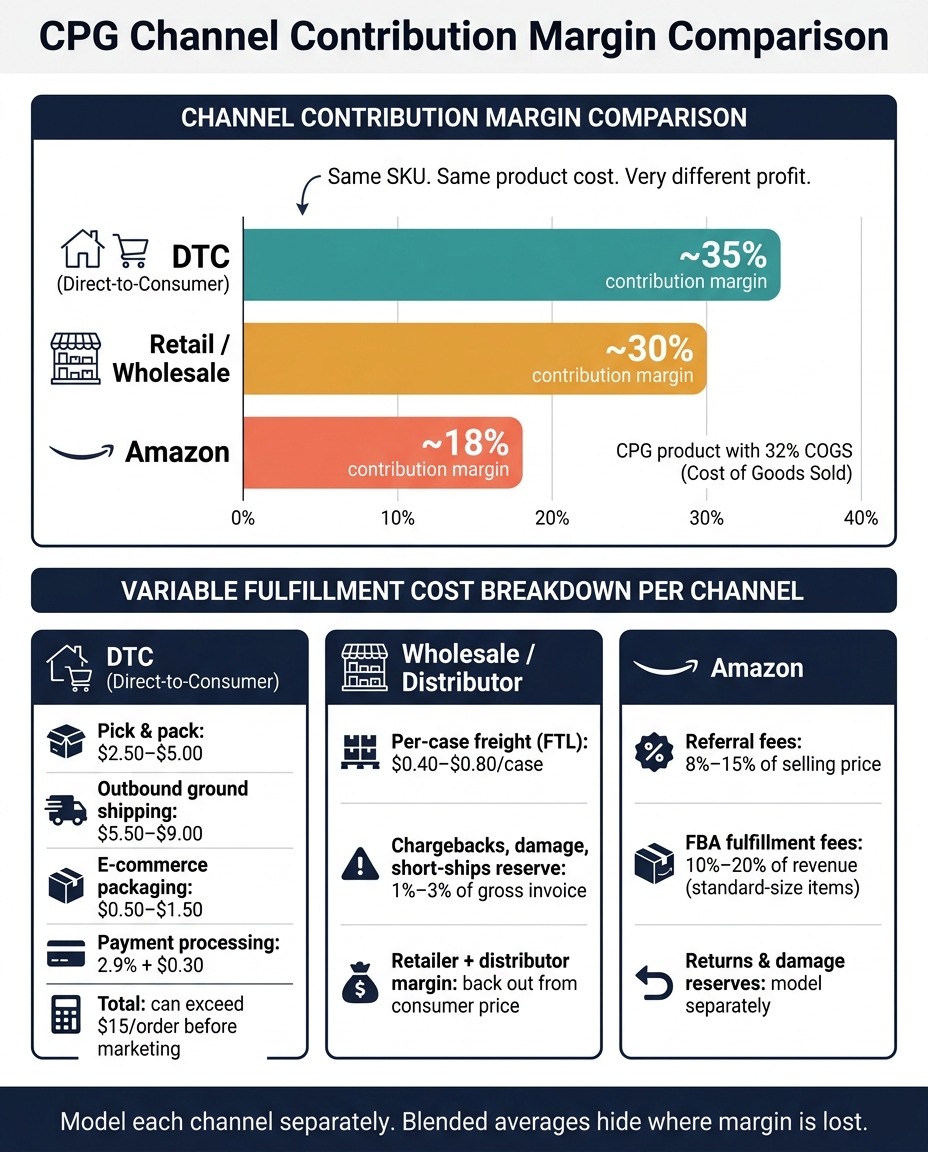
The same SKU can look very different depending on where you sell it. For a typical CPG product with 32% COGS, midpoint contribution margins are about 35% on DTC, 30% through retail/wholesale, and 18% on Amazon, even when product cost stays the same.[21][26] The reason is simple: each channel comes with its own fees, markups, and fulfillment costs.
For each channel, build a channel price waterfall. Start with the consumer-facing price, then work down to what the brand actually keeps. Model each channel from selling price to brand net proceeds. In wholesale, back out retailer and distributor margins. In DTC, subtract discounts, shipping charged to the customer, and platform fees.
Keep all channel assumptions in one tab so changes to pricing, fees, and freight flow through the model without extra cleanup.
After net revenue is set by channel, add the variable fulfillment costs. For a DTC order, that often means:
Put that together, and DTC fulfillment can top $15 per order before marketing.
Wholesale and distributor channels usually look lighter on this line. Per-case freight can be as low as $0.40–$0.80 per case on full-truckload shipments.[27] Amazon is a different beast. Referral fees often land at 8%–15% of the selling price by category, and FBA fulfillment fees can tack on another 10%–20% of revenue for standard-size items.[29][13]
Convert each channel cost into a per-unit or per-case number. Then subtract those costs from gross profit to get channel-level contribution margin.
Channel math can look better than it should if returns and deductions are left out. That’s a common miss. Model returns, damage, and short-ships as separate reserve lines for each channel.
For wholesale and distributor channels, reserve 1%–3% of gross invoice for chargebacks, damage allowances, and short-ships.[27] Show these as clear line items - Returns and Allowances and Damage/Spoilage Reserve. Apply them as a percentage of shipped units or gross invoice dollars, not tucked away inside overhead.
The bridge from gross margin to contribution margin is simple: Net Revenue − COGS = Gross Profit; Gross Profit − Variable Selling & Fulfillment Costs = Contribution Margin.[4][29]
Only include variable costs below gross margin. That usually means pick-and-pack fees, outbound freight, payment processing, marketplace commissions, chargebacks, and returns processing. Leave fixed SG&A out of this layer.
Track channel contribution margin both per unit and as a percentage of net revenue. That makes it much easier to see whether a channel is putting cash into the business before fixed overhead.
With contribution margin in place, the final step is to layer fixed SG&A and test EBITDA.
After contribution margin, SG&A is the last layer before EBITDA. The math is simple: EBITDA = Contribution Margin − SG&A.
That sounds straightforward, but this is where a lot of brands get tripped up. You can post healthy gross margin and still miss EBITDA if SG&A climbs faster than contribution margin. The monthly warning sign is SG&A as a percentage of net revenue. If that number goes up while contribution margin stays flat, EBITDA gets squeezed no matter how strong the product economics look.
In the model, each SG&A category should have its own monthly line item. That usually includes:
It also helps to split SG&A into fixed costs and part-fixed costs. Fixed costs include things like base salaries, rent, and software subscriptions. Part-fixed costs include items like agency retainers with performance bonuses or broker commissions.
A quick example makes the point fast: if monthly contribution margin is $250,000 and SG&A is $220,000, EBITDA is just $30,000.
That’s why the model needs to test EBITDA under shifting volume, price, and cost assumptions.
Don’t stress test at the brand-average level. Build it at the SKU-by-channel level. That’s where margin swings usually show up first.
Set three clear cases for each main driver. Here’s a practical example for one SKU:
| Driver | Baseline | Downside | Upside |
|---|---|---|---|
| Net price per case (USD) | $24.00 | $22.00 | $25.00 |
| Trade spend (% of gross) | 18% | 22% | 15% |
| COGS per case (USD) | $12.00 | $13.00 | $11.50 |
| Outbound freight per case | $2.00 | $2.50 | $1.80 |
| Returns & damages (% of units) | 2% | 4% | 1% |
| Contribution margin % | 38% | 30% | 43% |
In monthly reviews, use this table to ask one direct question: Under the downside case, does EBITDA stay positive? If not, act fast. Cut a hire, renegotiate supply, or reduce promotions. Trade promotion ROI below 1.0x should be cut or redesigned.[3]
A good setup is one tab for each SKU-channel combination, all feeding into a summary tab that layers in SG&A and shows monthly EBITDA. Then tie that model to actuals from your accounting system every month. That way, changes in price realization, freight, or returns hit the model in real time instead of showing up at quarter-end. Phoenix Strategy Group often adds board-ready summaries and documented assumptions for reporting and fundraising.
Use monthly actuals to refresh the bridge so the forecast stays tied to what’s happening in the business.
For most CPG brands, the EBITDA drivers that change profit the most are the same five every time: net price realization, trade spend, fully loaded COGS, outbound freight, and SG&A growth relative to contribution margin. Track those five every month against actuals, and the model starts doing its real job: helping you run the business.
Treat your margin model as a working tool, not a file you build once and forget. Update it as new data comes in so it stays accurate.
A simple review cadence looks like this:
You should also update inputs right away when supplier pricing, freight rates, or production volumes change in a material way.
COGS covers the direct costs of making or buying your products. These costs usually move up or down with production volume. Common examples include raw materials, packaging, direct labor, manufacturing overhead, co-manufacturing fees, quality control testing, and freight-in.
SG&A covers indirect operating costs that aren't tied to production. This bucket includes expenses like marketing, administrative salaries, corporate rent, office utilities, and sales commissions.
DTC usually delivers the best contribution margin, often landing in the 35% to 55% range. Amazon FBA tends to come in lower, usually around 15% to 30% once you factor in referral fees, fulfillment costs, and advertising.
Because each channel comes with its own cost structure, track contribution margin by channel instead of leaning on blended metrics.