Published on
October 27, 2025

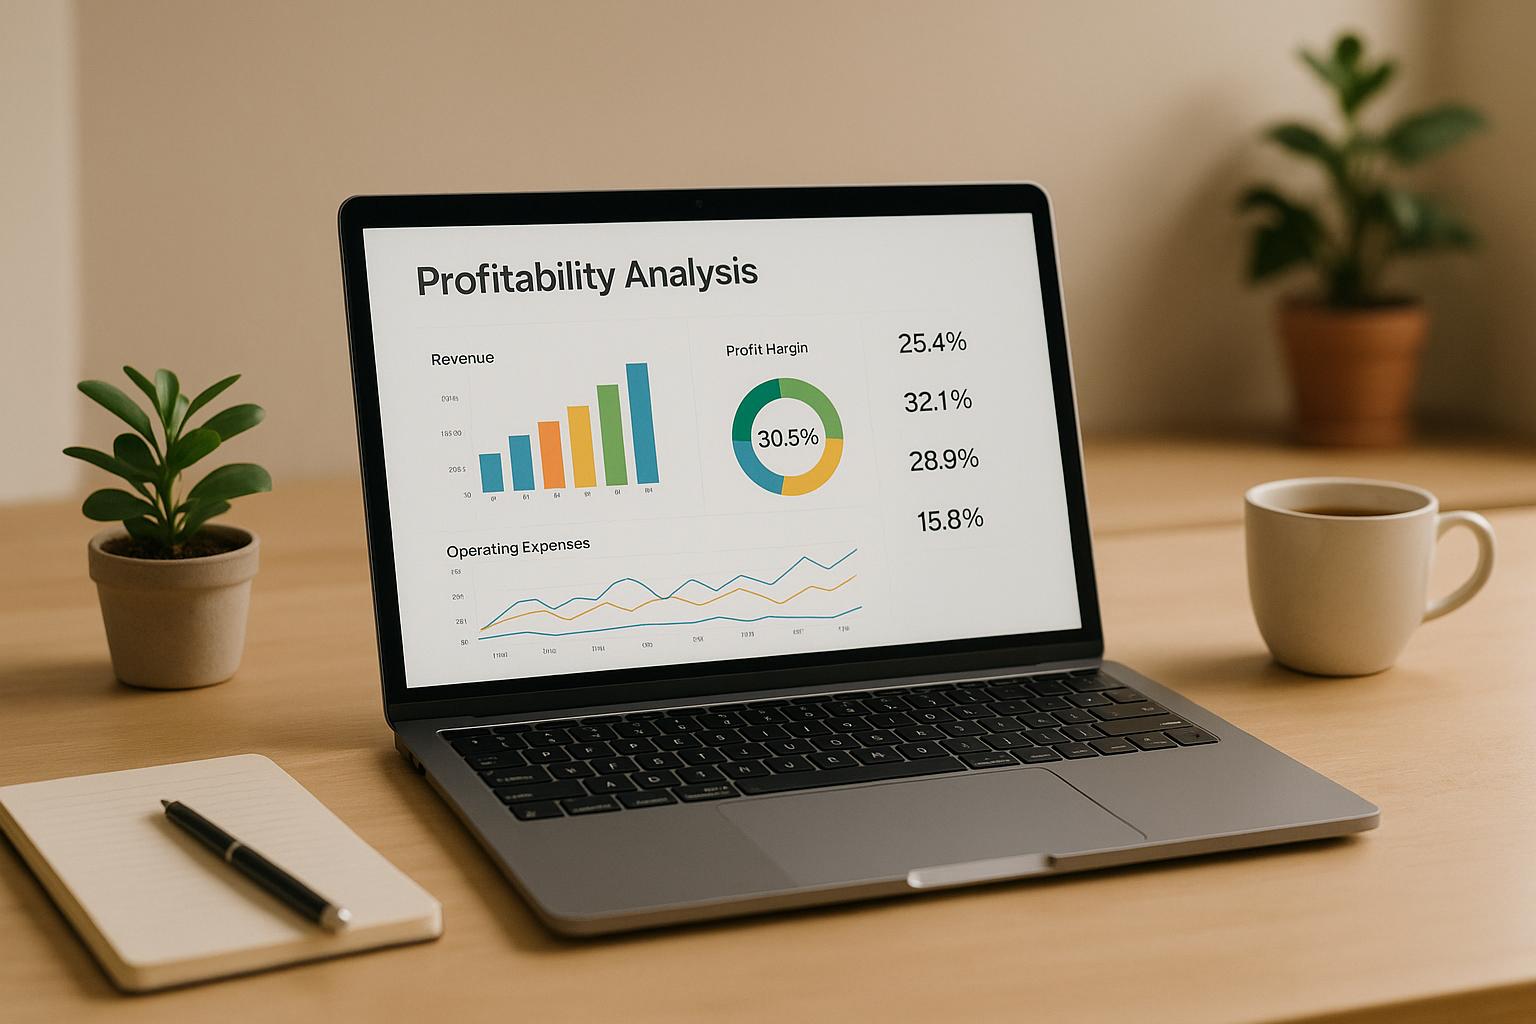
Running a small business comes with endless decisions, and understanding your financial health is at the heart of every smart choice. A profitability analysis tool can be a game-changer, helping you see exactly where your money is going and how much you’re truly earning. Whether you’re a retailer, freelancer, or service provider, knowing your numbers empowers you to grow with confidence.
Diving into your revenue, costs, and expenses doesn’t have to be daunting. With the right digital helper, you can quickly calculate key metrics like gross profit and net earnings without needing an accounting degree. This kind of clarity lets you spot trends—maybe your operating costs are creeping up—or celebrate wins when your margins improve. It’s not just about crunching numbers; it’s about building a roadmap for success.
If you’ve been guessing about your financial performance, it’s time to stop. Use a business profit calculator to get a clear picture in minutes. Small tweaks based on real data can lead to big results, whether you’re cutting unnecessary costs or reinvesting in growth. Start analyzing today, and watch your business thrive!
You’ll need a few key figures from your business records: total revenue (all income from sales), cost of goods sold (direct costs of producing your product or service), operating expenses (like rent or utilities), and taxes paid. If you’re unsure about exact numbers, even rough estimates can give you a helpful starting point. Just plug them in, and we’ll handle the math!
Your profit margin, shown as a percentage, tells you how much of every dollar earned turns into profit after expenses. A higher percentage—like 20% or more—often means your business is running efficiently, while a lower number might signal tight margins or high costs. Use this insight to compare against industry averages or track your progress over time.
No worries! Our tool checks for errors as you type. If you accidentally input letters or negative numbers where they don’t belong, you’ll get a friendly error message guiding you to fix it. This ensures your results are accurate and meaningful every time you use the tool.



