Published on
September 4, 2026


One SaaS company can get four different LTV numbers, depending on the formula used. If I want a fast estimate, I can use a simple lifespan or churn formula. If I need a number for budget, pricing, or max CAC, I need cohort data or customer-level cost data.
Here’s the short version:
ARPU × gross margin × average lifespanARPU × gross margin ÷ churnA few points matter most:
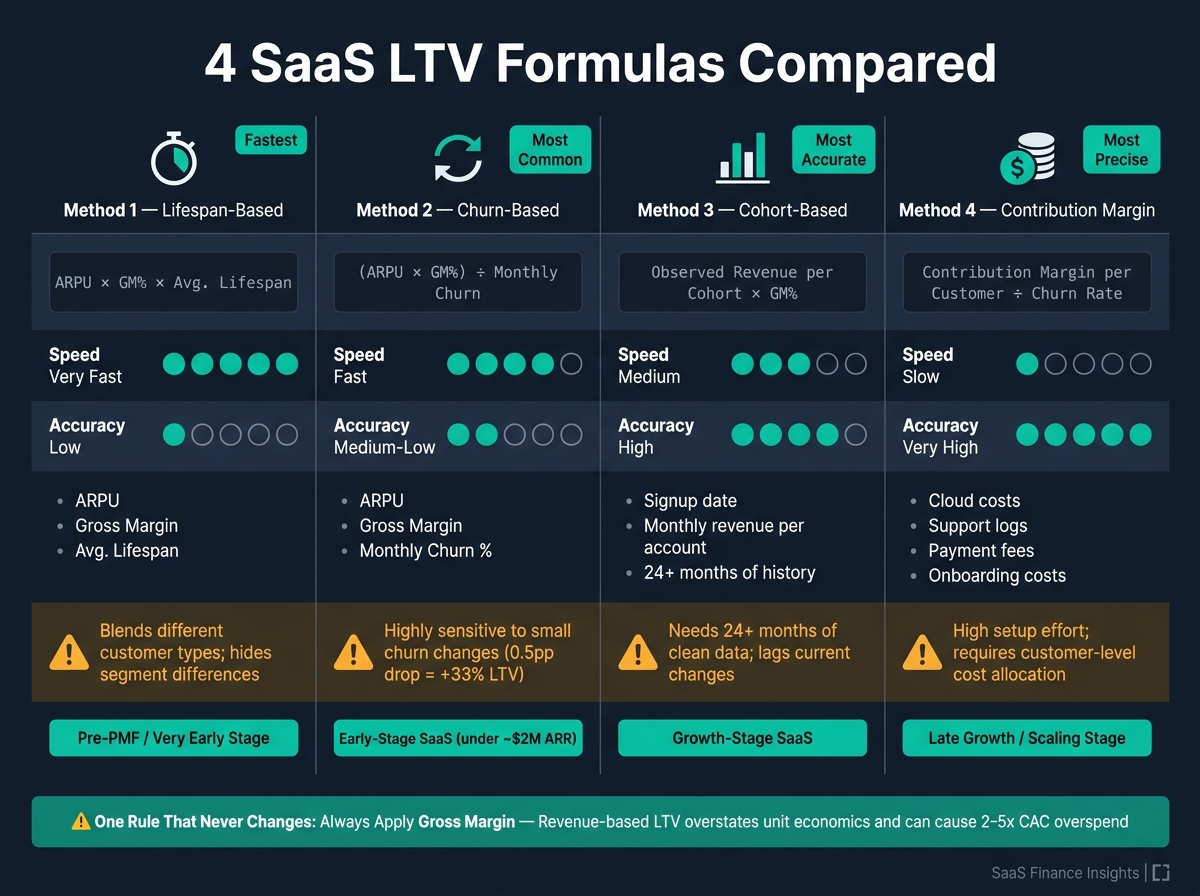
4 SaaS LTV Formulas Compared: Which One Should You Use?
| Method | Best for | Main input | Main issue |
|---|---|---|---|
| Lifespan-based | Very early estimates | Average lifespan | Blends different customer types together |
| Churn-based | Monthly tracking | Monthly churn | Swings hard when churn shifts |
| Cohort-based | Growth-stage analysis | Cohort revenue and retention | Needs a lot of clean history |
| Contribution margin | CAC and pricing decisions | Customer-level variable costs | Hard setup |
If I had to boil the article down to one rule, it would be this: <u>use the simplest LTV method that still fits the decision in front of you</u>.
These are the two simplest ways to estimate LTV. They’re a good starting point when you need a directional number, not a deep financial model.
This method takes your monthly ARPU, applies gross margin, and then multiplies that by the average number of months a customer stays.
It’s simple, and that’s the main appeal. You can explain it fast, even to people outside finance. The tradeoff is that average lifespan compresses retention into a single number. That can hide what’s happening across different customer groups. If one segment sticks around for years and another leaves fast, this method smooths all of that into one average.
Method 1 tends to fit best when you have stable, long-term historical data and a customer base that looks fairly similar from one account to the next.
This shortcut uses the idea that lifespan is equal to 1 ÷ churn. So the formula becomes: ARPU × gross margin ÷ monthly churn rate.
It’s a common method because it’s easy to update every month. It also reacts fast when retention shifts. That sounds helpful, but it cuts both ways. Small changes in churn can move LTV a lot. A 0.5 percentage point drop in monthly churn - from 2% to 1.5% - increases LTV by 33% [1][3].
That sensitivity is exactly why this method can get shaky. It starts to break when churn jumps around, when churn is very low, or when the business has expansion revenue. If monthly churn drops below 0.5%, the formula can spit out an almost infinite LTV [1][4]. And if net revenue retention is above 100%, this method misses that upside. In that case, both simple methods understate what a customer is actually worth [1][4].
One rule here is non-negotiable: use gross margin, not gross revenue, in LTV.
The table below shows where each simple method works best.
| Method | Formula | Key Inputs | Strengths | Weaknesses | Best Use Case |
|---|---|---|---|---|---|
| Method 1: Lifespan-based | ARPU × GM% × Avg. Lifespan | ARPU, gross margin, historical months | Simple; easy to explain to non-finance stakeholders | Lifespan estimate often hides segment differences; ignores churn volatility | Early-stage startups with stable, long-term historical data |
| Method 2: Churn-based | (ARPU × GM%) ÷ Monthly Churn | ARPU, gross margin, monthly churn % | Standardized; easy to track monthly; reflects recent retention shifts | Highly sensitive to small churn changes; assumes churn is constant; ignores expansion revenue | Growth-stage SaaS for directional planning and CAC sanity checks |
In many cases, these methods are enough below about $2M ARR, where directional planning matters more than precision.
The trouble starts when the stakes go up. If you’re setting budget, deciding how much to spend on acquisition, or trying to see which segments drive the most value, a blended average LTV can point you in the wrong direction [1][2]. That’s where these simple formulas stop pulling their weight.
For segmented businesses or companies with more ARR, the next step is usually cohort-based LTV and contribution margin LTV. Those approaches give you a much clearer read on what each customer group is worth.
These two methods cut down on guesswork and lean on what customers actually do.
Method 3 swaps churn assumptions for observed retention. Method 4 goes a step further and swaps revenue assumptions for profit. That difference keeps the main idea of this article in place even as the math gets tighter.
Instead of assuming churn stays constant, cohort-based LTV groups customers by the month or quarter they signed up. Then it tracks what those customers actually paid each month or quarter.
So rather than guessing retention, you measure real revenue retention.
The process is simple in concept: calculate cumulative revenue per cohort member, then multiply by gross margin. That gives you a clearer view of retention, expansion, and contraction by cohort.
Why does that matter? Because newer cohorts often act differently from older ones. Blended averages flatten those differences and can hide what’s going on under the hood.
This method needs at least 24 months of reliable subscription-level or invoice-level data to mean much [3]. The setup effort is moderate, but the upside is a much clearer view at the cohort level. You can spot which acquisition periods brought in your best customers and where segment-level pricing or acquisition strategy needs work.
If profit matters more than revenue, move to Method 4.
Method 4 asks a tougher question: after you account for what it costs to serve a customer, how much profit is left?
Contribution margin LTV subtracts customer-level variable costs from revenue, including:
That gives you profit-based unit economics instead of revenue-based unit economics.
And that gap can be big. Revenue-based LTV can overspend CAC by 2–5x [3] because it ignores costs that are very real.
The catch is setup difficulty. You need cost data assigned at the customer level, and many SaaS companies don’t have that ready by default. But for pricing decisions and setting a max CAC, this is the most precise method in the set.
Here’s a side-by-side look:
| Method | Data Needs | Implementation Effort | Insight Depth | Best Fit Stage |
|---|---|---|---|---|
| Method 3: Cohort-based LTV | Signup date, monthly revenue per account, invoice-level history | Medium | Captures real retention, expansion, and contraction | Growth stage |
| Method 4: Contribution Margin LTV | Cloud costs per customer, support logs, payment fees, onboarding costs | High | Reflects true profit-based unit economics | Late growth or scaling stage |
Both methods depend on clean data, but Method 4 is less forgiving.
You need clean customer IDs, consistent billing data, and cost allocation at the customer or product level. If that setup is messy, the output will be messy too. Garbage in, garbage out applies here in a very literal way.
Now that the four formulas are on the table, here’s the practical part: which one should you use?
This comparison maps each method to the data you have, how fast you need an answer, and where your company is right now.
| Method | Formula Summary | Required Data | Speed | Accuracy | Main Limitation | Best-Fit Scenario |
|---|---|---|---|---|---|---|
| 1. Simple Lifespan | ARPU × GM × Avg. Lifespan | ARPU, gross margin, average lifespan | Very Fast | Low | Overweights long-lived customers | Pre-PMF or very early stage |
| 2. Churn-based | (ARPU × GM) ÷ Churn Rate | ARPU, gross margin, churn rate | Fast | Medium-Low | Assumes constant churn | Early-stage SaaS with stable recurring revenue |
| 3. Cohort-based | Observed revenue per cohort × GM | Historical cohort data, monthly retention and revenue | Medium | High | Lags current retention changes | Growth-stage SaaS |
| 4. Contribution Margin | Contribution margin per customer ÷ churn rate | Customer-level COGS, cloud costs, support costs, onboarding costs | Slow | Very High | High setup effort; messy if cost data is unallocated | Mature or scaling SaaS |
Use the table to match formula complexity to the data you actually have.
A good rule of thumb: use the simplest formula your data can support.
Method 1 works when you need a fast directional estimate and you're still very early. Method 2 tends to become the default once churn stops moving all over the place. Method 3 starts to pull its weight once you have 2+ years of history and can compare customers by acquisition month or channel [3]. Method 4 makes sense at the scaling stage, when variable costs are big enough to skew gross margin and give you a fuzzy picture.
Most LTV mistakes don’t start with the formula. They start with the inputs.
A few common ones:
There’s another trap too: if your pricing or product changes in a big way, older cohorts may no longer reflect how current customers behave.
Bad inputs make every formula less reliable.
That comparison points to one rule: pick the formula that fits your data quality and the decision in front of you.
If your data is thin and you just need a directional read, simple lifespan- and churn-based methods can do the job. If precision matters more and the result needs to stand up in budget decisions, cohort-based models and contribution margin LTV make more sense.
One thing shouldn’t change: always apply gross margin. Revenue-based LTV can make unit economics look better than they are, and even small shifts in churn can move LTV a lot [2][3].
If the next step is cleaning up cohort data or tightening FP&A, support matters more than formula complexity. For cleaner cohort data and stronger FP&A, Phoenix Strategy Group can help.
Use the formula that matches your company’s data maturity, business model, and decision needs. For most growth-stage teams, cohort-based LTV tends to be the safest pick because it shows how customer behavior changes over time, including upsells and churn.
Simple churn-adjusted formulas work well for quick benchmarking. But they can miss account growth, which can skew the picture. The best move is to use the simplest model that still helps with forecasting and spending decisions, then back-test it against historical cohort data.
Switch once your business moves past the initial seed stage - usually after $500,000 in ARR - when blended averages start to hide the differences that matter.
You also need a cohort-based model when retention, customer mix, or channel performance changes by vintage, when the timing of cash flow matters, or when expansion and upsell revenue make a simple formula feel too flat.
Expansion revenue and downgrades can change LTV in a big way because they affect how much each customer pays over time. If you want a model that reflects what’s actually happening, track them separately from base churn.
Expansion from upsells, cross-sells, and usage growth can push LTV higher by offsetting churn. Downgrades do the opposite. And if you lump downgrades together with logo churn, you can miss what’s driving the change.
A cleaner way to look at it is with an expansion-adjusted formula: (ARPA × Gross Margin %) ÷ (Churn Rate − Expansion Rate).



