Published on
September 21, 2026


Most buyers do not pay extra just to be nice. If an offer comes in above standalone value, that extra price usually comes from expected synergies: lower costs, more sales, tax savings, or cheaper financing after the deal closes.
Here’s the short version:
A few numbers stand out. Public-company control premiums often fall in the 20% to 40% range. Buyers also rarely pay more than half of discounted synergy value upfront. And in one cited data point, sellers captured about 31% of expected synergy present value, while buyers paid an average 34% premium.
If I were a founder, I’d ask one simple question: Is this extra price based on near-term savings the buyer can show line by line, or on a deal model that looks good only in a spreadsheet?
This article breaks that down in plain English: what tends to drive synergy premiums, when buyers share that value at closing, and how I’d test whether the premium is supported or overstated.
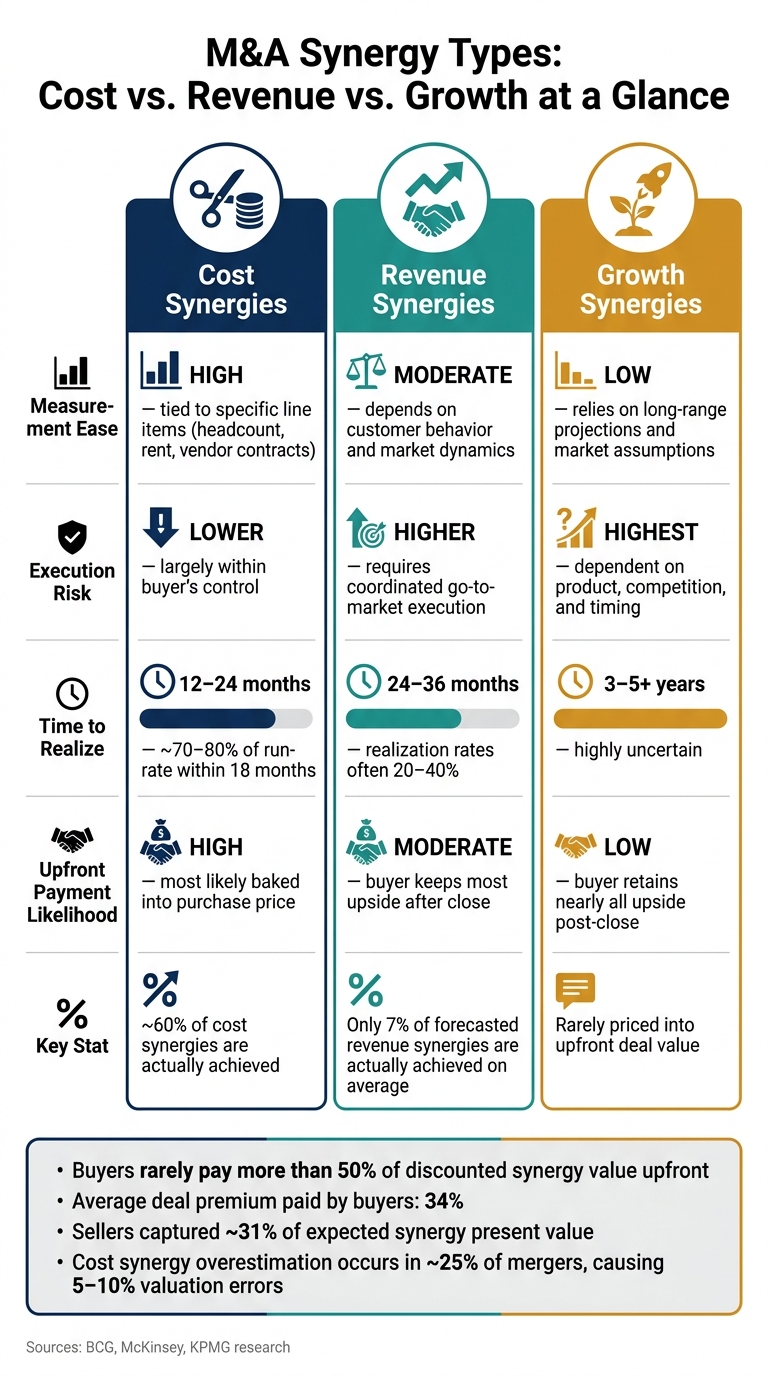
M&A Synergy Types: Cost vs. Revenue vs. Growth at a Glance
Buyers pay higher prices when the combined business can produce more cash flow than each company could on its own. That extra value can come from lower costs, more sales, or faster expansion. But the big issue isn't just whether synergies are there. It's which buyer can turn them into cash.
Cost synergies are the easiest to see and model. A strategic buyer can cut duplicate G&A, software, office, and procurement costs. And because those savings flow straight into EBITDA, they often carry a lot of weight in pricing.[6][7][4]
Revenue synergies are harder to pin down. They can still affect price when they are specific and testable, especially when the buyer can cross-sell through its current channels. Buyers also point to pricing power and geographic expansion, but both depend on market conditions and how customers react.[3][4][8]
Growth synergies are the toughest to value. They often take 3–5+ years to show up and come with the most execution risk. Because of that, buyers rarely pay full value for them at closing.[6][7][4][8]
| Synergy type | Ease of measurement | Execution risk | Typical time to realize |
|---|---|---|---|
| Cost | High - tied to specific line items (headcount, rent, vendor contracts) | Lower - largely within buyer's control | 12–24 months; about 70%–80% of run-rate within 18 months |
| Revenue | Moderate - depends on customer behavior and market dynamics | Higher - requires coordinated go-to-market execution | 24–36 months; realization rates often 20%–40% |
| Growth | Low - relies on long-range projections and market assumptions | Highest - dependent on product, competition, and timing | 3–5+ years; uncertain |
That split helps explain why strategic buyers and financial buyers often value the same target in very different ways. In many cases, buyers are willing to share some of the cost synergy value in the purchase price, while keeping most of the upside from revenue and growth for themselves.[13][14][5][3]
Operating synergies are only one part of the story.
A buyer may also pay more simply because its capital costs less. If that buyer uses a lower discount rate on the same cash flows, those cash flows are worth more even before adding any synergies.[8][10][11]
Tax items can matter too. Buyers may get extra value from NOLs or from a step-up in basis, which can increase after-tax cash flow. And the way the deal is structured can change that value by a lot.[6][4][8][9]
Then there's scarcity and urgency. If your company is the only solid route for a buyer to enter a certain market, reach a key customer relationship, or buy a technology it can't build fast enough, price pressure can climb in a hurry. When several strategic buyers are in the mix, fear of losing the deal can push offers above what a calm, stand-alone review would support. In some cases, that means a buyer ends up paying more than the synergies it can realistically capture.[15][16][18][19]
These forces - operating, financial, and deal-specific - help explain why one buyer will outbid another. The next issue is whether that extra value gets shared with the seller upfront or kept by the buyer.
Buyers almost never pay for all expected synergies upfront. In most deals, they price in only the share they think they can actually get. And even then, buyers rarely pay more than half of the discounted value of expected synergies, which reflects the usual haircut for uncertainty and integration risk.[20] So the key issue isn't whether synergies are there. It's which synergies the buyer is ready to pay for today.
Buyers tend to pay more when synergies are concrete, near-term, and within their control. Put simply, specific savings that can show up soon are easier to price into the deal.
Urgency also matters a lot. If the target controls a product, capability, or channel that rivals want too, losing the deal can cost more than paying up. In U.S. transactions, that can add 10%–30% to the premium when the synergies are visible, near-term, and controllable.[20]
Repeat acquirers can sometimes stretch higher because they've done this before. If they have a proven integration playbook, they can make a stronger case for paying more upfront. That's why the premiums buyers can defend most often tie back to synergies they can measure and control.
Revenue and growth synergies are much less likely to get paid upfront. Why? Because they depend on customer behavior, competition, and plain old execution.
| Deal situation | Synergy visibility | Integration risk | Premium structure |
|---|---|---|---|
| High-confidence cost-cutting (e.g., overlapping G&A, shared vendors) | High | Low to moderate | More likely baked into the upfront price[19][12] |
| Short-timeline deal with a repeat-integration buyer | High | Low | Higher premium; more synergy value shared with seller[17] |
| Speculative cross-sell or market-expansion thesis | Lower | High | Buyer keeps most or all synergy upside after close[19][23] |
| Regulatory or culturally complex combination | Low to moderate | High | Conservative premium; significant synergy haircut applied[22][23] |
If a buyer pays the full value of synergies upfront, there's no room left for value creation on their side. That's why buyers pull back when integration may take more than three years, when fit between the two companies is unclear, or when approvals could slow things down. In those cases, they move synergy value out of the purchase price and keep it as post-close upside. That spread is exactly what founders should pressure-test in the buyer's model.
Once a buyer explains the premium, founders need to test the logic behind it. Don’t accept the model as a black box. Pull it apart. The job here is simple: separate synergy value that might hold up from optimism that’s already baked into the price.
Start by asking for a line-item synergy schedule. It should break each claimed benefit into cost, revenue, growth, tax, and financing buckets across the forecast years. Then check four things for each item: who owns it, when it ramps, what it costs to put in place, and how likely it is to happen.
For cost synergies, ask for exact cuts in headcount, facilities, and vendor contracts, along with annual run-rate savings and any one-time restructuring costs. For revenue synergies, push the buyer to show customer- or segment-level assumptions: conversion rates, pricing moves, product attach rates, and timing. Those inputs should come from past results, not hand-wavy percentage lifts. Growth synergies need to tie back to named actions like new product launches, market expansion, or added channels, with clear timing and staffing plans. Tax synergies should spell out annual cash tax savings and include support from tax advisor analysis. Financing synergies should rest on term sheets or lender letters, not verbal claims.
You should also ask for an integration plan that puts one-time integration and restructuring costs by quarter, in dollar terms and as a share of combined revenue. Integration costs can equal 50%–100% of year-one announced synergies, often spread over 18–24 months.[5] That number alone can change the picture fast.
From there, sort each synergy into high-, medium-, or low-likelihood. Then rerun the model using expected value. That version tells you how much of the premium has a case behind it, instead of just showing the buyer’s best-looking story.
A fast way to spot aggressive underwriting is to line up the buyer’s case against a more cautious one. One of the biggest warning signs is Year 1 margin expansion with no ramp and no restructuring costs. Full cost synergy capture on day one almost never happens. McKinsey finds that in roughly 25% of mergers, cost synergies are overestimated by at least 25%, which can create valuation errors of 5%–10%.[26][27] Revenue synergies are even tougher: on average, only 7% of forecasted revenue synergies are actually achieved, versus about 60% of cost-cutting synergies.[28]
If the model assumes synergy capture will be fast and friction-free, the premium is probably too high. Here’s a simple way to read the most common trouble spots:
| Aggressive Assumption | Why It's Risky | More Conservative Interpretation |
|---|---|---|
| Immediate EBITDA margin jump in Year 1 | Assumes full cost synergies with no ramp or restructuring costs | Model a 12- to 36-month ramp and add restructuring costs[24][30] |
| Zero integration disruption to revenue | Ignores customer churn, sales distraction, and system migration delays | Introduce slower growth or a temporary dip in the first 12–24 months; probability-weight revenue synergies[24][28] |
| Cross-sell adoption ≥50% within 12 months | Overstates customer willingness and ignores actual sales cycles | Benchmark against historical attach rates; KPMG data shows revenue synergies arrive about 18 months later than scheduled[29] |
| Vague synergy narratives like scale benefits or brand strength | No operating plan, no named owner, no KPIs | Treat the claim as unproven until the buyer provides line-item detail and an accountable executive[31][32] |
| Full-value credit for uncertain revenue synergies | Treats probabilistic outcomes as guaranteed | Apply probability weighting and discount later synergies to present value at the buyer's cost of capital[25][30] |
When a buyer’s model shows several of these patterns at the same time, that’s a sign the premium may rest on assumptions that won’t hold up in the messy part after signing. That’s usually when founders should push for a more cautious case or shift part of the consideration into earnouts tied to specific synergy KPIs, so the buyer pays the full premium only if those synergies show up.
A synergy premium is only real when the buyer can actually collect it. That value needs to be specific, time-bound, and net of integration costs. BCG found that buyers paid an average 34% premium, while sellers captured about 31% of the present value of expected synergies.[1][33] That gap matters. It suggests buyers often keep part of the upside for themselves unless the deal process gets heated or their confidence runs unusually high.
So the test is pretty simple: compare the offer against standalone value, realizable synergy value, and integration costs. If the premium is higher than the risk-adjusted present value of those synergies, then you're being asked to pay for the buyer's assumptions.[21][2] When that happens, it may make sense to push back, restructure the consideration, or tie part of the price to clear performance milestones.
A synergy premium is the extra amount a buyer pays based on value they expect to create after a merger. That can come from cost savings, more revenue, or other strategic gains.
A control premium is the extra amount paid to take control of the target company, whether or not those gains ever show up.
Buyers usually pay more for cost synergies because those gains are easier to predict and easier to turn into results than revenue synergies.
Think about where the savings come from: cutting overlapping roles, combining facilities, or renegotiating supplier contracts. Those moves often start showing up within 12 to 18 months.
Revenue synergies are a different story. They rely more on cross-selling, upselling, market expansion, and more involved integration work. That makes them tougher to forecast and harder to underwrite.
Founders can spot an overstated synergy premium by pressure-testing the assumptions behind it instead of taking projections at face value. If a synergy can’t be linked to a clear owner, a timeline, key milestones, and a measurable financial result, it’s probably more wishful thinking than an actual plan.
Scenario analysis helps here. Test conservative, base, and optimistic cases, and build in the chance that integration costs come in 25% to 50% higher than expected. Also check that Contributory Asset Charges aren’t set too low, and make sure revenue forecasts leave out speculative expansion.



