Published on
July 30, 2026

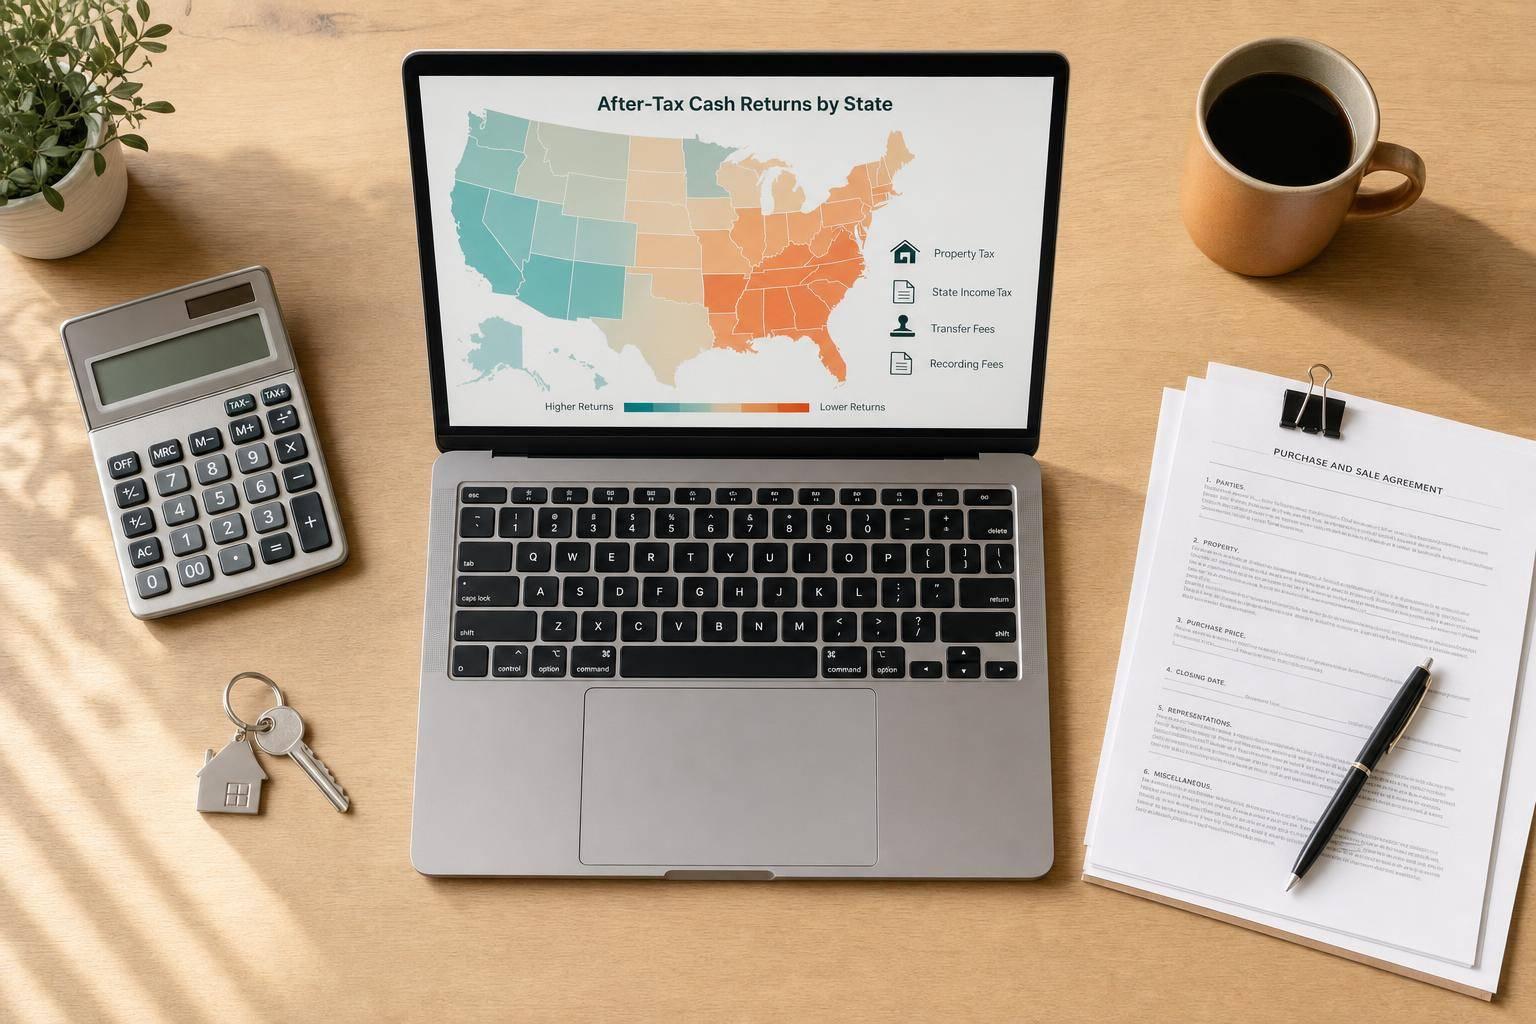
A real estate deal can look good on paper and still lose ground once state taxes hit. I’d screen every property with four cost lines up front: state income tax, property tax, transfer tax, and recording or mortgage charges.
Here’s the short version:
If I were comparing deals across states, I would keep it simple:
| Tax cost | When I’d feel it | What it changes |
|---|---|---|
| State income tax | Each year and at sale | After-tax cash flow, exit proceeds |
| Property tax | Every year | NOI, DSCR, monthly carry |
| Transfer tax | Buy and/or sale | Closing costs, basis, net sale cash |
| Recording / mortgage charges | Closing | Cash needed on day one |
The main point is simple: I would not ask which state is cheapest. I would ask which deal leaves the most cash after all state and local taxes are counted.
No-income-tax states can leave more money in your pocket each year. But that doesn't mean the deal is cheaper from top to bottom. Property tax, insurance, and taxes at sale can chip away at a big part of those savings.
The main issue isn't whether you save on income tax. It's what replaces that savings.
Rental income is taxed where the property sits, not where you live. So if you own a rental in Arizona, you still file Arizona Form 140NR as a nonresident [4]. And while Washington doesn't have a broad income tax, it does impose a capital gains excise tax on some exits.
Property tax is often the biggest offset. In Texas, property tax assessments in Austin, Dallas, and Houston suburbs rose 8% to 15% year-over-year in 2025–2026 [7]. In Florida, investment properties in Miami-Dade and Broward counties are seeing annual assessment increases of 10% to 12% [7]. Non-homestead properties in Miami-Dade also tend to carry effective tax rates between 1.8% and 2.2% [6].
Then there's insurance. In Florida and Louisiana, homeowners often pay 300% to 400% of the national average for property insurance because of hurricane and flood risk [2]. That kind of cost can hit cash flow fast.
So yes, no-income-tax states can make sense, especially for long-term owners holding assets that are going up in value. That can look even better next to California's top marginal rate of 13.3% [6]. But the math only works if property tax, insurance, and entity-level costs don't swallow the gain.
Here are the main tradeoffs by state:
| State | Income Tax | Effective Property Tax (Approx.) | Transfer Tax | Key Watch-Out |
|---|---|---|---|---|
| Texas | None | 1.80% (Houston) [1] | None | Aggressive annual reassessments [7] |
| Florida | None | 1.80%–2.20% (Miami-Dade) [6] | 0.70% (Miami) [5] | Insurance 3–4× national average [2] |
| Tennessee | None | 0.71% (Memphis) [1] | 0.37% (Nashville) [5] | Lower appreciation historically |
One more thing: check whether moving a property into an LLC triggers reassessment. If it does, your annual tax bill can jump right away.

For multi-state portfolios, Phoenix Strategy Group models property tax, transfer tax, entity filings, and exit timing so owners can see true after-tax cash flow before closing. That's a big deal when a deal crosses state lines and the tax drag is easy to miss.
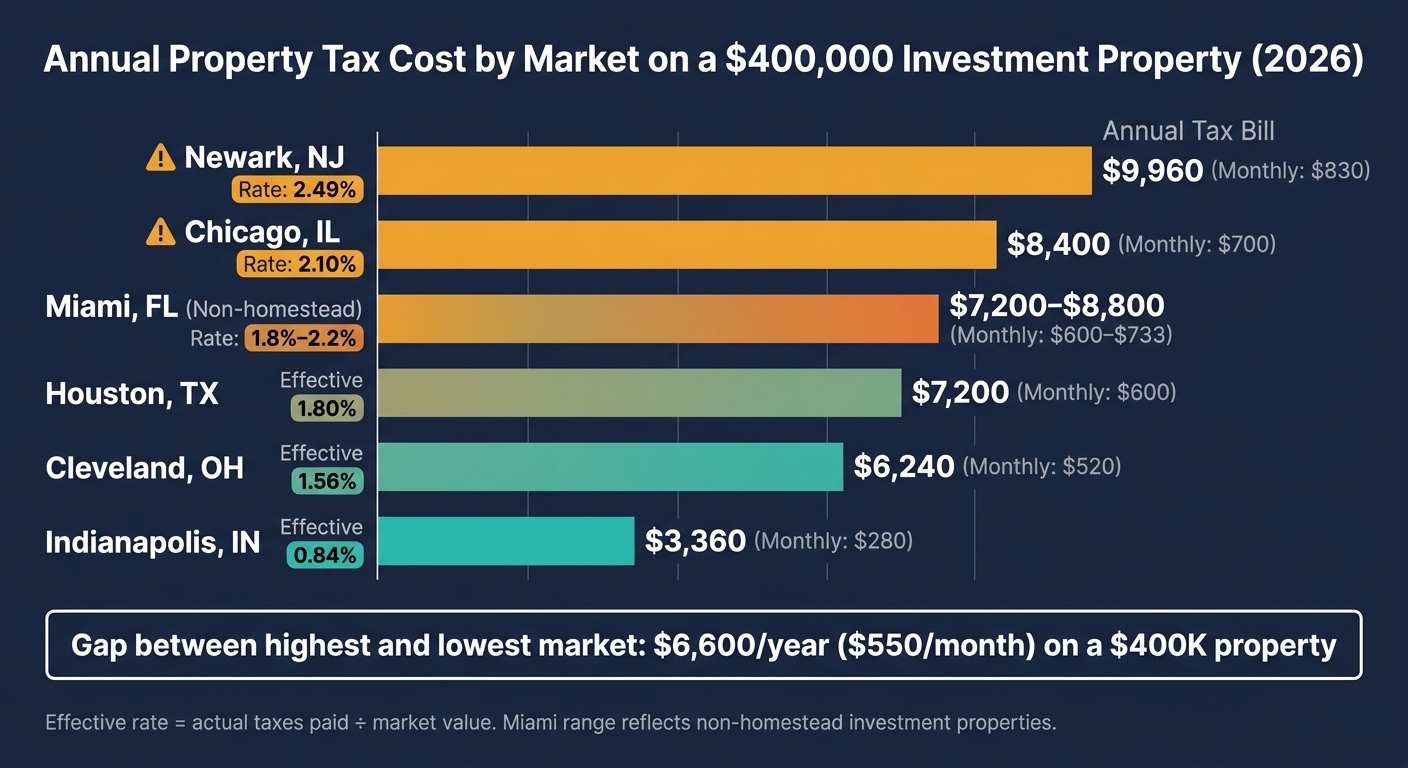
Property Tax Cost by Market on a $400K Investment Property (2026)
Even in a state with no income tax, property tax can wipe out the upside. A high tax bill cuts cash flow, squeezes DSCR, and pulls value down. Property tax reduces NOI and, in turn, value[1].
The posted tax rate doesn't tell the whole story. The number that matters is the effective tax rate: actual taxes paid divided by market value. You also need to know whether the assessment resets after a sale[1].
That reset can hit hard. In many areas, assessed value jumps to the purchase price when title transfers. So a seller's low bill may have nothing to do with what you'll pay in year one. If you miss that, your underwriting can be off from day one[1].
Here’s how that looks on a $400,000 property across six markets in 2026[6][1]:
| Market | Effective Tax Rate | Annual Tax Bill | Monthly Tax Cost |
|---|---|---|---|
| Newark, NJ | 2.49% | $9,960 | $830 |
| Chicago, IL | 2.10% | $8,400 | $700 |
| Miami, FL (Non-homestead) | 1.8%–2.2% | $7,200–$8,800 | $600–$733 |
| Houston, TX | 1.80% | $7,200 | $600 |
| Cleveland, OH | 1.56% | $6,240 | $520 |
| Indianapolis, IN | 0.84% | $3,360 | $280 |
In markets with effective rates above 1.5%, base your numbers on the post-reset tax bill, not the seller's current bill[1]. That's the bill you're far more likely to face, so it belongs in the pro forma from the start.
After that, focus on DSCR. In high-tax markets, you want to test DSCR using the post-reset bill. If taxes climb faster than rents, the cushion can disappear fast. A lower LTV can give you some breathing room if the assessment moves up after closing[1].
A few steps can help:
That appeal process is often worth the trouble. It usually takes 2–3 hours per property each year and can save $800 to $3,000 annually[1]. That's not pocket change, especially if you're watching every line item.
One cost investors miss all the time is Community Development District (CDD) bond assessments in master-planned communities. These can add $3,000 to $8,000 per year in holding costs, and they often don't show up in the first listing details[8]. The same goes for Mello-Roos charges. Check for both before closing, because they can change your carry costs in a big way[8].
If the annual property tax bill still works, then closing taxes become the next thing cutting into returns.
Annual property taxes get most of the attention. But in some markets, the taxes and fees tied to the sale itself can hit returns almost as hard.
Transfer taxes and recording charges change a lot from one state or city to the next. At purchase, they increase your basis. At sale, they reduce your net proceeds. Recording fees create the same kind of drag at the closing table. Once you account for annual property-tax costs, these one-time transaction taxes are the next big cost to bake into the deal.
The gap between markets is huge.
Arizona charges no state or county transfer tax, which makes it one of the lower-cost places in the U.S. to close a deal [4]. At the other end, some states and local governments stack transfer and recording charges on top of each other. In those places, total transaction taxes can climb well past 1% of the sale price [2]. California is a common example, where county and city transfer taxes are often layered together, pushing closing costs higher in a hurry [4].
Who actually pays those charges is a separate issue. In some markets, sellers usually cover the transfer tax. In others, buyers do. And in plenty of deals, the parties split it. The key point is simple: the purchase agreement decides who pays, not local habit [2].
The clearest move is to deal with it head-on in the contract. Don’t assume local custom will carry the day. Spell out who pays each transfer, recording, and filing charge [2].
If the back end of the deal matters more than the initial closing hit, tax deferral can matter too. For investment property, a 1031 exchange can defer capital gains tax and depreciation recapture if you follow the rules: identify the replacement property within 45 days, close within 180 days, and use a qualified intermediary [3].
And this is where the math gets real fast. A small percentage may not sound like much on paper, but on a seven-figure deal, it can feel like a punch to the wallet.
| Market Type | $400,000 Deal | $1,000,000 Deal |
|---|---|---|
| No transfer tax state (e.g., AZ) | $0 | $0 |
| 1% transfer tax state | $4,000 | $10,000 |
| 2% layered market (e.g., certain CA/PA cities) | $8,000 | $20,000 |
Note: Figures reflect approximate government transfer and recordation charges only, excluding title insurance and other closing costs [2][4].
On a $1,000,000 deal, the gap between a no-transfer-tax market and a 2% layered market is $20,000 in cash at closing. That’s day-one money out the door, so it needs to be in your numbers before you make the offer [2].
Once you own property in more than one state, tax costs add up fast. The smartest move is to use the same four tax inputs in every market so you can compare each deal on one after-tax basis. That way, you're judging the total tax drag, not just a nice-looking rate on a state tax chart.
Use this checklist to screen each market before underwriting:
No single state tax rate tells the full story.
A no-income-tax state can still come with heavy property tax and insurance costs. On the other side, high-property-tax states can squeeze NOI and push operating expenses above 65% of gross income in the worst markets [1][2][6]. And transfer-tax-heavy markets chip away at both your buy-side numbers and your sale proceeds, which can be a nasty surprise if you wait until the closing table to model them.
When you buy across state lines, the better question isn't "Which state is cheapest?" It's "Which deal leaves the most after-tax cash?" The portfolios that hold up over time usually come from modeling all four cost layers - income tax, property tax, transaction taxes, and filing duties - before any money goes out the door.
Compare deals using state-specific costs, not national averages. That part matters more than a lot of investors think.
A rental in a low-tax state can look almost the same on the surface as one in a high-tax state, then play out very differently once the bills start rolling in. So tweak your expense ratio based on property-tax levels:
Use the effective tax rate, not the MLS rate. The MLS number can be misleading if it doesn’t reflect what the owner will actually pay after reassessment or local rules kick in.
And don’t stop at property taxes. You also need to factor in:
That’s how you get a deal analysis that matches what the property will cost in real life, not just what it looked like in the listing.
High property tax rates can hit monthly cash flow hard in real estate investing.
Property taxes are a fixed operating expense, so they come straight out of your rental income. That means less money left over each month.
In high-tax markets, this is where investors often get tripped up. If you lean on standard expense-to-income ratios, your cash flow estimate can look better than it is. And the gap doesn’t have to come from a huge tax jump. Even a small difference in the tax rate can add up to thousands of dollars per year.
Property tax reassessments usually follow a state or local schedule, and that schedule can vary a lot depending on where you live. In many states, a property sale can also set off a reassessment, often resetting the assessed value to your purchase price.
Work that needs a building permit may lead to an immediate reassessment. And because some states are shifting to more frequent revaluations, it’s smart to review every assessment notice and keep an eye on updates from your local assessment office.



