Published on
August 31, 2026


Top-down revenue forecasting gives you a fast way to estimate sales when you don’t have much history yet. I start with the market, narrow it from TAM to SAM to SOM, apply a market share estimate, add pricing, and then check whether the result lines up with what the team can sell.
Here’s the short version:
If I’m working with an early-stage SaaS company, this method helps answer a simple question: Is this market even big enough to matter? But that answer only helps if I pressure-test the assumptions behind growth, share, pricing, hiring, and sales capacity.
A simple way to think about it:
| Part | What it means |
|---|---|
| TAM | The full market if 100% of buyers paid for the product |
| SAM | The part of that market the company can actually serve |
| SOM | The share it may win in a set period |
| Top-down | Starts with the market |
| Bottom-up | Starts with sales data, team output, and pipeline |
In practice, I’d use top-down forecasting to set direction, not to build a monthly cash plan. For that, I’d still want a bottom-up view to see whether revenue targets fit the company’s sales pace, budget, and team size.
Below, I break down how to use this method without letting market-size math turn into a bad revenue target.
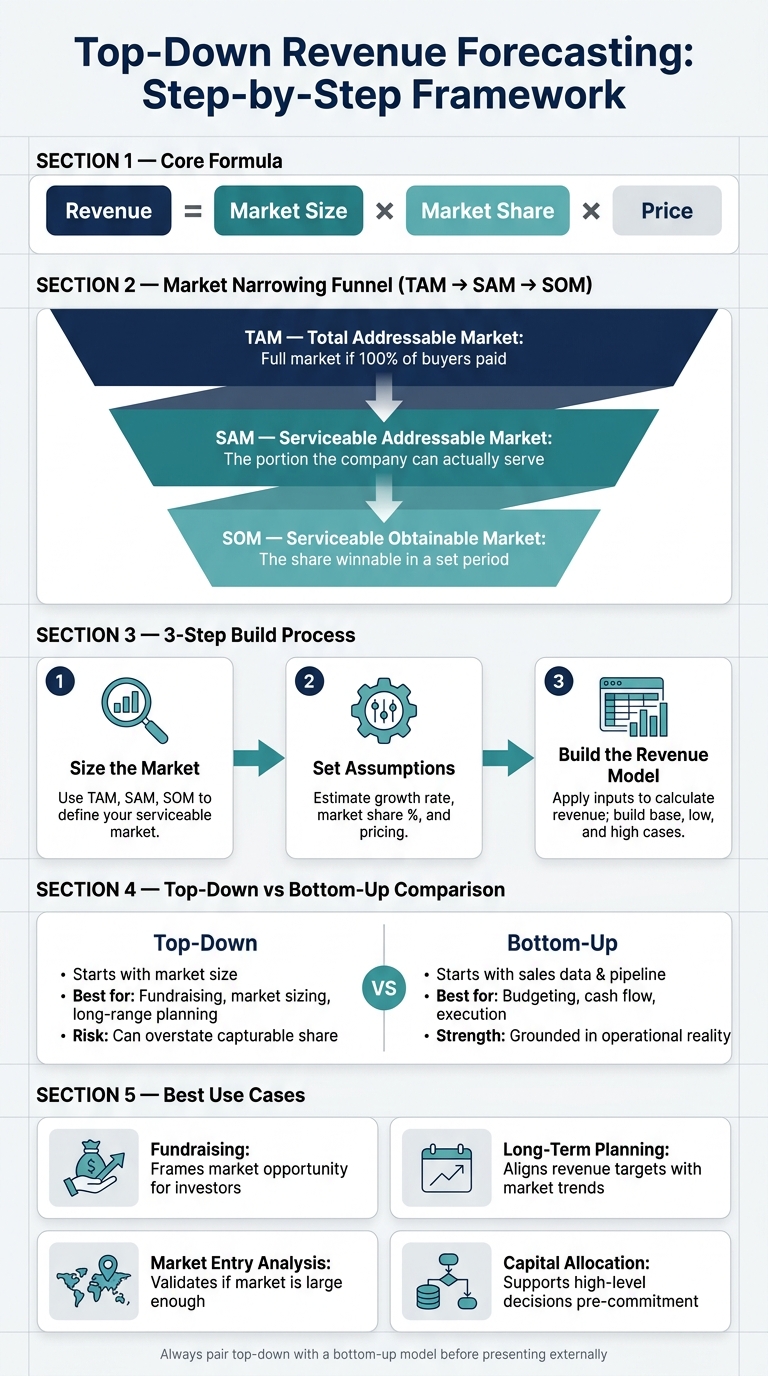
Top-Down Revenue Forecasting: Step-by-Step Framework
Once the framework is set, the next move is market sizing. Start with TAM, SAM, and SOM so you can narrow the full market down to the portion you can actually serve. That matters a lot when you're early and don't have much sales history to lean on.
The point isn't to map every possible buyer on earth. It's to define a serviceable market you can use for planning.
After you size the market, turn that view into assumptions about what you can win and what you can charge. Estimate the market's growth rate, your realistic share, and the price your offer can support.
In SaaS, pricing often has more impact than unit costs. A small change in price can shift the whole forecast, which is why this part deserves extra care.
Once market size, share, and pricing are set, turn those inputs into revenue. Apply market size, growth, share, and pricing to calculate revenue, then roll that output into your operating model.
It also helps to build multiple cases. That way, you can test whether the model still works when assumptions change, instead of betting everything on one perfect scenario.
After you size the market and set up the model, the next step is simple: stress-test the assumptions behind it.
You need a few core inputs:
For SaaS and digital products, pricing often drives a big part of the model because marginal delivery costs are low.
Where those assumptions come from matters just as much as the numbers themselves. Market size and growth should be checked against external benchmarks and macro data. Pricing should come from your pricing plan and any early sales data you already have. The strongest forecasts blend market data with internal judgment.
Have the business owner, sales leader, and CFO or finance lead review those assumptions together.
Once the forecast is built, validate the assumptions behind it. A top-down model can spit out a number your team simply can't hit. That's the main risk.
Before you put a revenue target in front of investors or other stakeholders, run a few plain-English reality checks.
Compare your top-down output with your actual sales data. Then compare it with a bottom-up forecast. If those numbers drift apart, something in the assumptions is off. From there, test whether the result lines up with how the business actually runs.
Reconcile your top-down and bottom-up outputs before presenting anything externally. If they land in the same range, there's a better chance the assumptions are grounded. If they're far apart, dig into the gap and adjust before a cash shortfall or investor concern shows up later.
Finance support can turn those checks into a tighter model. If you don't have an in-house finance lead, a contract or fractional CFO can help analyze the financial data and structure the forecasting model.
Phoenix Strategy Group helps growth-stage companies pressure-test forecasts and connect revenue assumptions to the broader financial plan. That makes the forecast easier to defend in planning and fundraising.
Top-down forecasting works best as a directional tool, not an operating plan.
Once the model is built, the next step is simple: Can you trust the output?
Top-down forecasting is useful for directional planning, not precision budgeting. You can build it even without past sales data, which makes it helpful early on. But there’s a catch. It can overstate the share you can win and gloss over the cost, hiring, and distribution work needed to get there.
The tradeoff is straightforward: broad market visibility in exchange for lower day-to-day precision.
| Factor | Strength | Weakness |
|---|---|---|
| Market clarity | Shows the opportunity at a high level | Can overstate what is realistically capturable |
| Operational detail | Useful for long-term strategizing | Too broad for budgeting or cash flow forecasts |
Most weak forecasts break down in the same place: they assume market size turns neatly into revenue.
The biggest mistake is treating TAM like captured revenue. That usually shows up as a market share estimate with no tie to distribution capacity, hiring plans, or the spend required to win that share. On paper, the model can look persuasive. In practice, the company may miss the target by a mile.
A better approach is to tie share assumptions to distribution capacity and cost. For growth-stage teams, Phoenix Strategy Group can support that review with fractional CFO services and FP&A support.
Use top-down forecasting when the goal is strategic direction, not line-by-line execution. It tends to fit best before detailed operating data exists, when sizing a market, or when shaping a fundraising story.
| Use Case | How Top-Down Forecasting Helps |
|---|---|
| Fundraising | Frames the market opportunity for investors |
| Long-term strategic planning | Helps leadership align revenue targets with market growth trends |
| Market entry analysis | Evaluates whether a target market is large enough to justify investment |
| Capital allocation | Supports high-level decisions before committing capital |
Don’t use top-down forecasting on its own for budgeting or cash flow planning. Use top-down to frame the opportunity, then use bottom-up to test whether the plan can actually work.
Top-down forecasting is a strong place to start. But it works best when you use it as a directional guide, not as your day-to-day operating plan.
The idea is simple: size the market well, use realistic assumptions for share and pricing, and then test those numbers against what your team can actually deliver. That’s where this method earns its keep.
Once you’ve built the base model, put it under pressure. A base case, a conservative case, and an optimistic case make the forecast easier to test - and easier to defend when someone starts poking at the assumptions.
Use top-down forecasting for market framing and fundraising. Use bottom-up forecasting for budgeting and execution. If your team needs help building and validating both views, a fractional CFO or FP&A partner like Phoenix Strategy Group can test the assumptions against operating capacity before they go in front of investors or leadership.
The last check is whether the forecast ties into the rest of the financial model. When revenue assumptions line up with the income statement, cash flow statement, and balance sheet, the forecast becomes a planning tool your team can actually use.
To estimate your Serviceable Obtainable Market (SOM) in a realistic way, don’t lean only on broad industry percentages. Instead, connect revenue to specific, measurable activities. Use your historical data and industry benchmarks for the target segments you want to win.
Then pressure-test those assumptions against your operational capacity. Look at things like lead volume, conversion rates, and sales rep productivity. After that, use a top-down check to make sure the numbers still line up with the overall market size and your projected share.
Use market research or industry benchmarks to size your TAM, and cite the sources.
For SAM, narrow that TAM using practical filters like:
For pricing, rely on past transactions or contracts, planned pricing updates, and the main revenue drivers: volume, average selling price, and, when it matters, retention or expansion.
For longer-range top-down forecasts, include market growth rates and your target share.
Use top-down forecasting for long-term projections, usually three to five years out, or when you need to size up market potential and decide where to put time, people, and budget. It’s especially useful for early-stage startups that don’t yet have much detailed operating data.
This method works best as a strategic check, not your main operating forecast. Build your core forecast from bottom-up business drivers first. Then use a top-down view to test whether your targets make sense in the context of the broader market.



