Published on
August 21, 2026


The same $2 million in revenue can lead to very different prices. In most cases, SaaS gets valued on ARR or revenue, healthcare on EBITDA, and home services on SDE or EBITDA. That happens because buyers care about how steady the revenue is, how much margin is left, and how much risk sits with the owner, staff, or compliance.
If I boil the article down, the message is simple:
| Sector | Common valuation method | Usual range in the article | What lifts value | What pulls value down |
|---|---|---|---|---|
| SaaS | EV/ARR or EV/Revenue | 3x-10x | Low churn, 110%+ NRR, high gross margin, efficient CAC | Weak retention, mixed revenue quality, customer concentration |
| Healthcare services | EV/EBITDA | 5x-10x | Strong commercial payer mix, clean compliance, steady same-site growth | Billing issues, reimbursement risk, physician dependence |
| Home services | SDE or EBITDA | 2x-12x | Service agreements, low owner reliance, technician retention | One-time jobs, weak books, labor issues, founder-led sales |
A simple way to think about it:
So when I read this piece, the takeaway is clear: valuation gaps are mostly risk gaps. Clean numbers, repeat revenue, and less key-person risk are what move a company toward the top end of its range.
In lower-middle-market SaaS deals, buyers usually start with ARR quality.
ARR and MRR matter a lot. But they only matter if the numbers come from actual subscription contracts, not one-time implementation fees or professional services mixed in to make revenue look bigger than it is.
Buyers tend to focus on a pretty specific set of metrics: NRR above 110%, gross churn below 5–10%, CAC payback under 12–15 months, LTV:CAC above 4–5x, gross margins of 70–85%+, and Rule of 40 scores above 40.[3][4][9][10] If growth is strong and the unit economics hold up under diligence, buyers will often value the company on EV/ARR or EV/Revenue instead of current EBITDA.
That’s why private SaaS deals can look very different from other lower-middle-market transactions. Best-in-class private SaaS companies can trade around 7–10x EV/ARR, while average performers usually fall in the 4–7x range.[6][9]
That shifts the valuation lens from software efficiency to regulated cash flow.
Lower-middle-market healthcare services often trade at 6–10x EBITDA, but that range can move a lot based on items that don’t show up neatly in a profit-and-loss statement.[8]
One of the biggest drivers is payer mix. A business with more commercial insurance revenue will often support stronger EBITDA margins and a higher multiple. Heavy reliance on Medicare or Medicaid brings reimbursement risk, and buyers tend to price that in fast. During diligence, they also dig into denial rates, collection efficiency, and billing accuracy. If they find a history of coding issues, they may cut normalized EBITDA or shift part of the deal into earnouts.[8]
Compliance is also a hard line item. Buyers review licensing status, HIPAA controls, clinical governance, and any open billing or documentation problems. A company with clean compliance can sit near the top of the sector range. One with open issues, even small ones, can face a 2–3x multiple discount or tougher escrow terms.[8]
Same-store growth of 3–5% annually is viewed as healthy in many healthcare sub-sectors, and buyers want that shown by location, not only in a rolled-up company view.[11][12]
Healthtech follows SaaS-style EV/ARR logic, not practice-based EBITDA logic.[3][6][9]
In home services, diligence shifts from regulation to workforce stability and repeat work.
When regulation and contract structure matter less, buyers spend more time on labor, repeat revenue, and how much the business depends on the owner. Home services companies are most often valued on SDE when they’re smaller and owner-operated, and on EBITDA when they have a more built-out management team.[1][2][7]
Smaller owner-led shops often trade at 3–5x SDE. Recurring-service models, such as pest control, can reach 7–12x EBITDA.[1][2][5][7]
The businesses that earn better pricing usually have a few things working in their favor:
Businesses with 40%+ of revenue from recurring agreements often get meaningfully higher multiples than non-recurring peers.[1][2][7] On the other hand, customer concentration and owner-led sales relationships tend to pull valuations down toward the low end.
| Sector | Valuation Method | Typical Multiple Range | What Pushes It Higher |
|---|---|---|---|
| SaaS | EV/ARR or EV/Revenue | 4–10x EV/ARR or EV/Revenue | NRR 110%+, Rule of 40 above 40, CAC payback under 12–15 months |
| Healthcare Services | EV/Adjusted EBITDA | 6–10x EBITDA | Commercial payer mix, clean compliance, same-store growth of 3–5% |
| Home Services | SDE or EBITDA | 3–12x (varies by trade) | Recurring agreements, low owner dependence, technician retention |
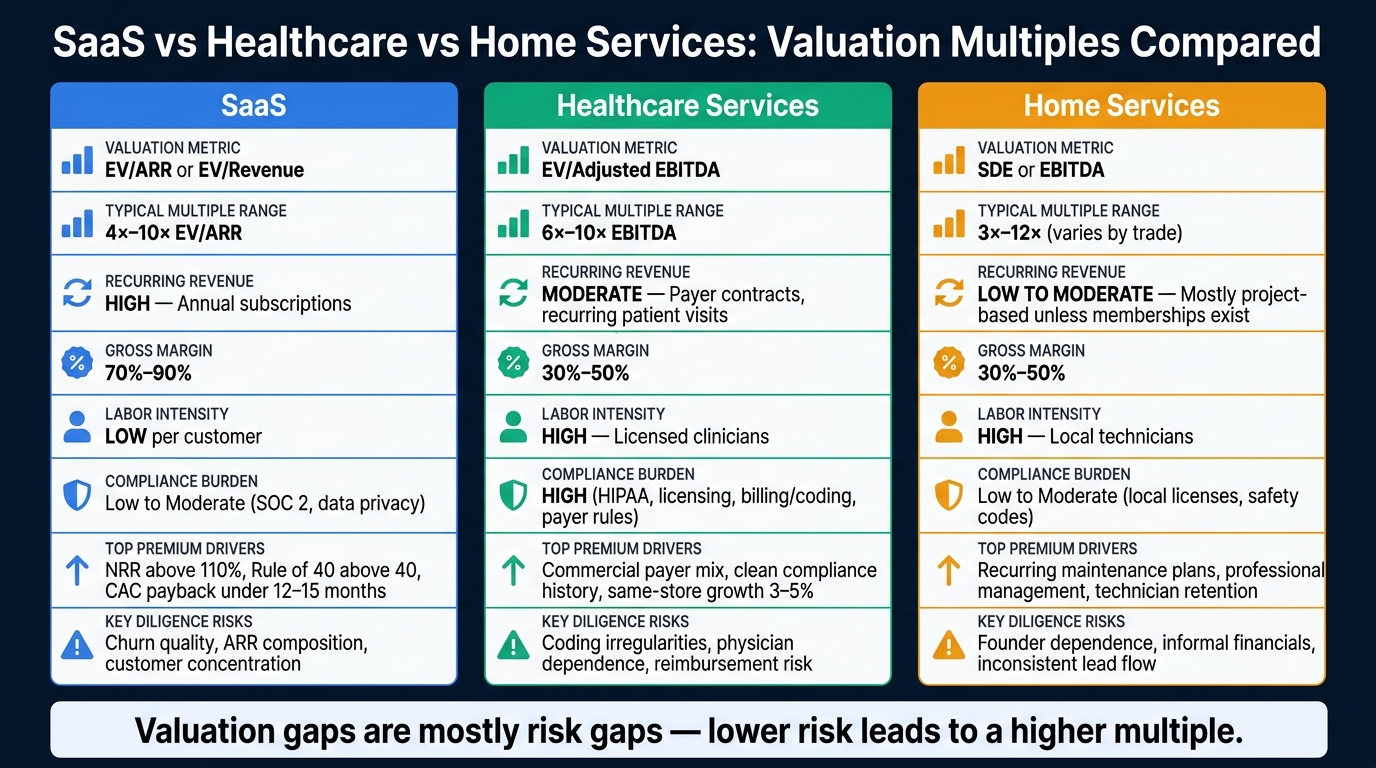
SaaS vs Healthcare vs Home Services: Valuation Multiples Compared
Valuation gaps usually come down to business model risk. In plain English, buyers are looking at three things: how steady the revenue is, how much labor it takes to deliver the service, and how much uncertainty they have to take on. Those three factors shape the gap that shows up during diligence.
The clearest difference is labor intensity. Healthcare and home services need more people, more coordination, and more day-to-day execution for each new dollar of growth. That makes scaling harder and tends to push multiples down. SaaS works differently. A SaaS company can add customers without adding headcount at the same rate, which is why buyers often pay more for each dollar of revenue.
Contract structure adds to that gap. A B2B SaaS company with annual auto-renewing agreements gives buyers a much cleaner view of future cash flow. A home services business built mostly on one-time jobs gives them far less they can project with confidence. Healthcare lands somewhere in the middle. Payer contracts add some structure, but patient volume can still move around based on referral trends or physician turnover.
| Sector | Valuation Metric | Recurring Revenue | Gross Margin | Labor Intensity | Top Premium Drivers | Key Diligence Risks | Scaling Constraints | Compliance Burden |
|---|---|---|---|---|---|---|---|---|
| SaaS | EV/ARR | High - annual subscriptions | 70%–90% | Low per customer | NRR above 110%, capital efficiency | Churn quality, ARR composition, customer concentration | Product and go-to-market - not labor-constrained | Low to moderate (SOC 2, data privacy) |
| Healthcare Services | EV/EBITDA | Moderate - payer contracts, recurring patient visits | 30%–50% | High - licensed clinicians | Commercial payer mix, clean compliance history, multi-site scale | Coding irregularities, physician dependence, reimbursement risk | Clinician hiring, credentialing timelines, payer contract negotiations | High (HIPAA, licensing, billing/coding, payer rules) |
| Home Services | SDE or EBITDA | Low to moderate - mostly project-based unless memberships exist | 30%–50% | High - local technicians | Recurring maintenance plans, professional management, technician retention | Founder dependence, informal financials, inconsistent lead flow | Technician availability, local market saturation, geographic expansion costs | Low to moderate (local licenses, safety codes) |
Risk tolerance is the second big factor. Regulation can help more than people expect. In healthcare, the licensing, credentialing, and compliance systems needed to run a multi-site clinical practice are hard to copy. That can create a moat. When buyers believe compliance lowers risk instead of adding more of it, regulated businesses can earn stronger premiums. Home services companies don't get the same protection. Barriers to entry are lower, which makes competition easier to start and harder to hold off.
Growth pace also changes how buyers put deals together. Healthcare usually grows at a steadier rate, with organic same-clinic growth often landing in the single or low double digits each year. Buyers tend to model that with caution and often use earnouts to split risk around new site openings or payer negotiations. Home services growth has a more obvious ceiling. A company can only grow as fast as it can hire and train technicians, and buyers build that limit into their numbers.
At the end of the day, founders are priced on cash-flow durability, not just revenue. Once that gap is visible, the next move is to fix the reporting and operating issues that keep value down.
Valuation gaps usually come down to risk. After buyers dig into the financials and operating data, they decide how much uncertainty is still left. Better reporting lowers that uncertainty and can support a stronger multiple. And because SaaS, healthcare, and home services are priced on different metrics, each one needs its own proof package.
Each sector needs different proof. Buyers want the numbers that show whether revenue and earnings are likely to hold up after closing.
For SaaS, that starts with clean ARR definitions, a reconciliation from GAAP revenue to ARR, and cohort analysis that shows retention and expansion by customer vintage. Founders should also have unit economics ready, including CAC by channel, CAC payback, LTV/CAC, gross margin, and contribution margin per customer.
For healthcare, the reporting package should focus on normalized EBITDA, payer mix trends, denial rates, days in AR, collection rates, and compliance records. Buyers want to see how reimbursement and volume have changed over time. They also want clear separation between one-time items and recurring operating results. Documented corrective actions can help cut compliance-related discounts.
For home services, buyers usually look at how much of the business comes from recurring work versus one-time jobs. They also want agreement counts and density, renewal rates, revenue per technician, technician utilization, and branch-level P&Ls. Businesses with more recurring revenue tend to earn higher SDE multiples than project-heavy companies.
Most founders already have the raw data. The issue is that it often sits in disconnected systems - billing platforms, EHR software, field-service tools, and CRMs - and no one has turned it into a clear picture that lines up with what buyers expect. When the data is scattered, buyers tend to discount the story.
That’s where integrated advisory support can help. Phoenix Strategy Group helps connect fragmented data into investor-grade reporting. For SaaS clients, that means ARR and retention dashboards tied directly to billing and CRM data. For healthcare, it means payer mix and reimbursement models linked to EHR and billing data. For home services, it means route, technician, and branch profitability reporting that separates recurring agreements from one-time jobs.
The point is simple: make the company’s actual quality easy to see, not dressed up. If buyers can’t trace reported numbers back to data they trust, they often push harder in diligence and reprice the deal. Low-quality financial reporting materially increases the likelihood of renegotiation or failure [13][14]. Clean books, reconciled schedules, and sector-specific unit economics leave less room for buyer discounting. The cleaner the reporting, the harder it is for the market to misread the business model.
Across SaaS, healthcare, and home services, the same rule holds: lower risk leads to a higher multiple. Buyers don't pay up just because a company sits in a certain sector. They pay for predictable cash flow.
That's why two businesses with the same revenue can end up with very different price tags. A strong SaaS company can win a premium ARR multiple when retention is solid and the business runs efficiently. A healthcare practice with clean payer mix data and a multi-provider panel trades at a higher EBITDA multiple than one tied to a single physician. In both cases, the difference isn't the industry. It's the quality of the business model underneath it.
The work is pretty clear:
Those steps help close valuation gaps. And the stakes are high. A key-person risk discount can wipe out millions of dollars in enterprise value. That matters most in the 12 to 24 months before a raise or exit.
The multiple follows the model. Build a durable, scalable, well-documented business, and valuation tends to follow.
Recurring revenue can increase valuation because subscription-style payments make cash flow more predictable and longer-lasting. That lowers risk for buyers and investors, which can lead to higher revenue multiples.
It also gives buyers a clearer view of growth and customer lifetime value through metrics like ARR, MRR, net revenue retention, and churn. In plain English, those numbers make future performance easier to model and easier to trust.
The key metric is the one that best predicts long-term value creation.
That metric changes by business type:
Reduce key-person risk by moving the business from founder-dependent to system-driven. Put clear standard operating procedures in place, document day-to-day operations, assign ownership, and train staff so the company can run without your constant input.
If the business still depends too much on the founder, buyers may lower the valuation. Support from Phoenix Strategy Group can help put these systems in place and tighten financial reporting to back a stronger exit value.