Published on
August 25, 2026

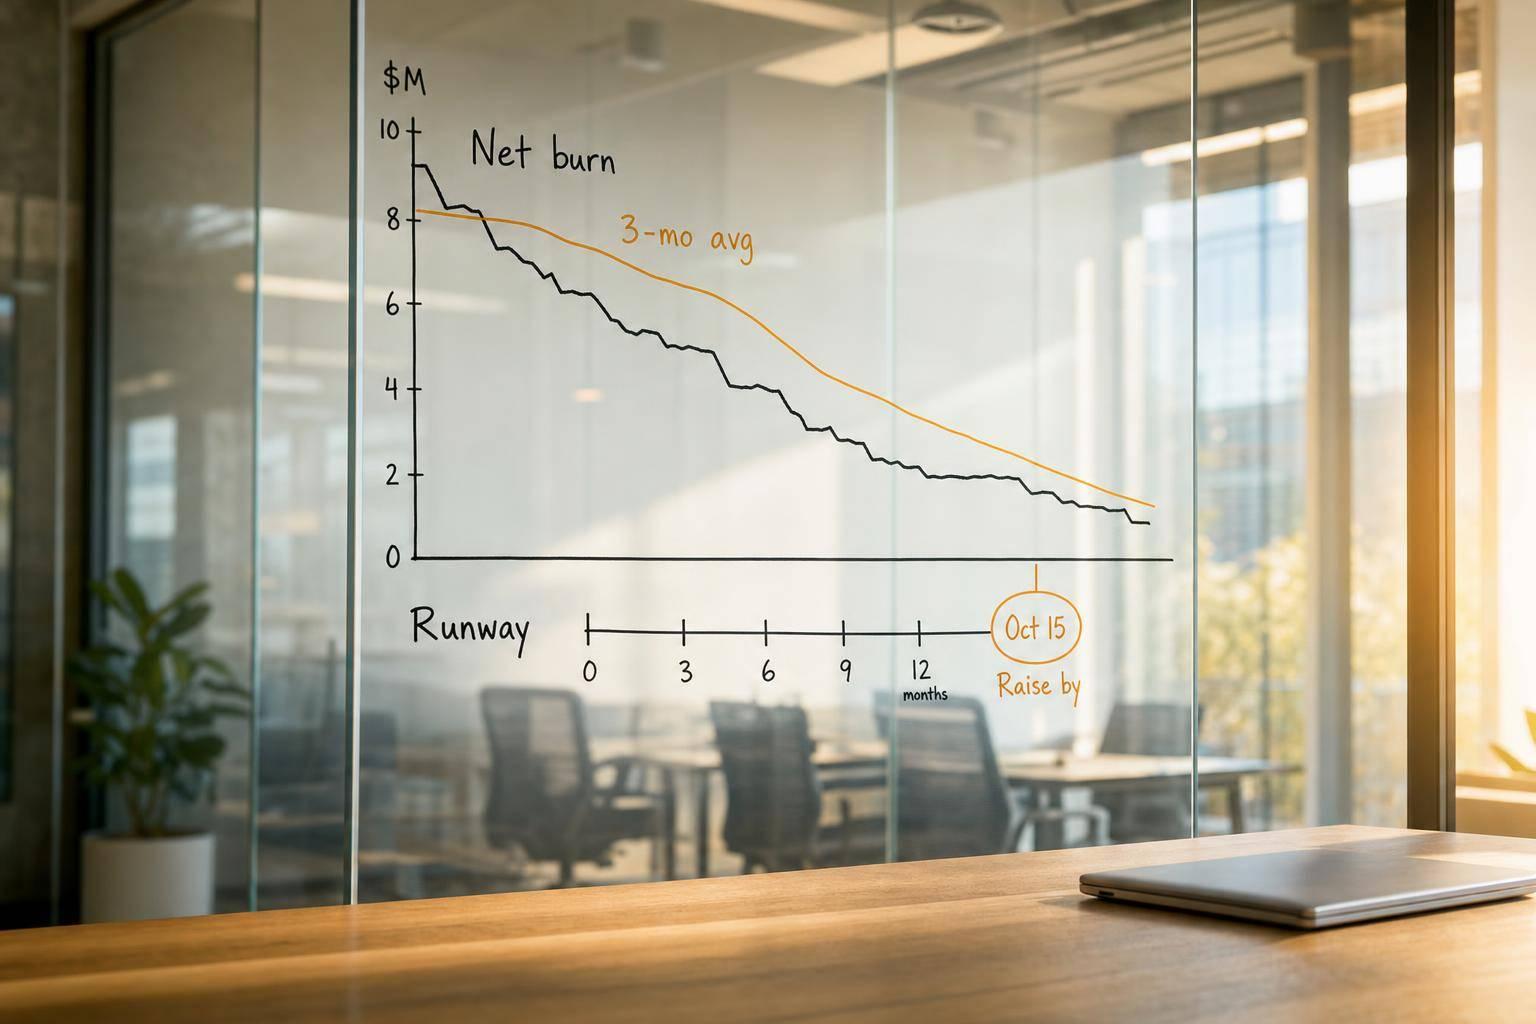
If I had to boil this down to one point, it’s this: cash - not revenue - tells me how long a startup can keep going. I track net burn, use a 3-month average, tie it to headcount plans, and set a clear fundraise date before cash gets tight.
Here’s the short version:
A simple example: if a startup has $3,000,000 in the bank and burns $250,000 per month, that’s 12 months of runway. But if collections slow, payroll rises, or five new hires add about $75,000 a month, that runway can shrink fast.
I’d treat burn and runway as a monthly habit, not a one-time math exercise. The article breaks down the numbers, the forecast cadence, the hiring link, and the board mistakes that can make cash look better than it is.
Start by locking down these four terms. If people use loose definitions, the numbers drift, and board confidence takes a hit.
Gross burn is your total monthly operating cash outflow before customer collections. That includes payroll, taxes, benefits, contractors, rent, software, cloud costs, marketing, insurance, professional services, vendors, travel, and expensed equipment.
Net burn is gross burn minus customer cash inflows. If gross burn is $400,000 and collections are $150,000, net burn is $250,000. That’s the amount coming out of cash on hand.
Runway comes straight from net burn: divide current cash on hand by monthly net burn. If you have $4,000,000 in the bank and a net burn of $250,000 per month, you have 16 months of runway.
Burn multiple is net burn divided by net new ARR for the same period. If you burned $3,000,000 over 12 months and ARR grew by $1,000,000, your burn multiple is 3.0x.
| Burn Multiple | Investor Interpretation |
|---|---|
| ≤1.0x | Capital-efficient growth |
| 1.0x – 2.0x | Healthy, steady growth |
| 2.0x – 3.0x | Acceptable during high-growth periods |
| >3.0x | A warning sign - needs a clear plan to improve |
The big issue here is simple: what counts as operating cash?
On the outflow side, include payroll and employer payroll taxes, employee benefits, contractor and freelancer payments, office rent, software subscriptions, cloud infrastructure, paid media and marketing, insurance premiums, legal and accounting fees, and routine vendor payments. Many startups manage these complexities by hiring a fractional CFO to oversee cash flow.[1][5][8][10][12][13]
On the inflow side, count only customer cash collections: ACH, wires, card receipts, checks, and prepaid subscriptions when the cash lands.[11][13][14] Leave out noncash revenue, bookings, signed contracts, equity raises, debt proceeds, and interest income.[2][3]
There’s one edge case that trips people up: customer prepayments. They can make net burn look better in the month the cash comes in, but that bump doesn’t mean the business suddenly changed shape. A trailing average helps smooth that out so runway stays grounded in reality.
Boards want the same calculation every month. They care about trends, not one-off snapshots.[6][7][9] If net burn is calculated one way in March and another way in July, you can’t tell whether the business is getting better or getting worse.
In a standard monthly board package, investors usually zero in on four numbers:
They also look at gross burn to see the cost base underneath the top line, especially when revenue can briefly hide how fast fixed costs are growing.[4][6][7] Burn multiple helps them judge whether growth is getting more efficient over time.
That only works if the method stays the same month after month. Once the definitions are fixed, the next move is to calculate them the same way every single time.
Once you lock your definitions, stick with the same monthly cash inputs at every close. Close the month, pull operating cash outflows from your cash flow data, and add them up. That gives you gross burn.
Then subtract customer cash collected - not invoiced revenue or booked revenue - to get net burn. After that, divide month-end cash on hand by your average monthly net burn to calculate runway in months.
Here’s the math in plain English: $160,000 in operating outflows minus $60,000 in collections equals $100,000 in net burn. If you have $960,000 in cash and an $80,000 trailing burn, you have 12 months of runway. Use that same operating baseline in every monthly close.
One month on its own can throw you off. A one-time payment or timing issue can move burn up or down without saying much about the actual direction of the business. That’s why the trailing 3-month average should be the denominator for reported runway.
Say net burn was $70,000 in May, $90,000 in June, and $80,000 in July. The trailing average is $240,000 ÷ 3 = $80,000. That $80,000 is the number to use in your runway calculation.
Still, don’t ignore the current month. Track it on its own. If July’s burn comes in at $95,000 while the trailing average is $80,000, add a footnote that explains the one-time item behind the jump. That small bit of context can save a lot of confusion later.
Leave financing and investing cash flows out of the burn calculation. A Series B raise or venture debt draw changes your cash balance, but it does not change operating burn. If you mix those items in, net burn can look lower than it is, and runway can look longer than it is.
The same rule applies to capex. It belongs in investing cash flow, not operating burn.
Keep operating burn on its own so runway stays tied to the business model and flows cleanly into hiring plans and forecast planning. That operating baseline is the number you carry into hiring decisions and the next forecast cycle.
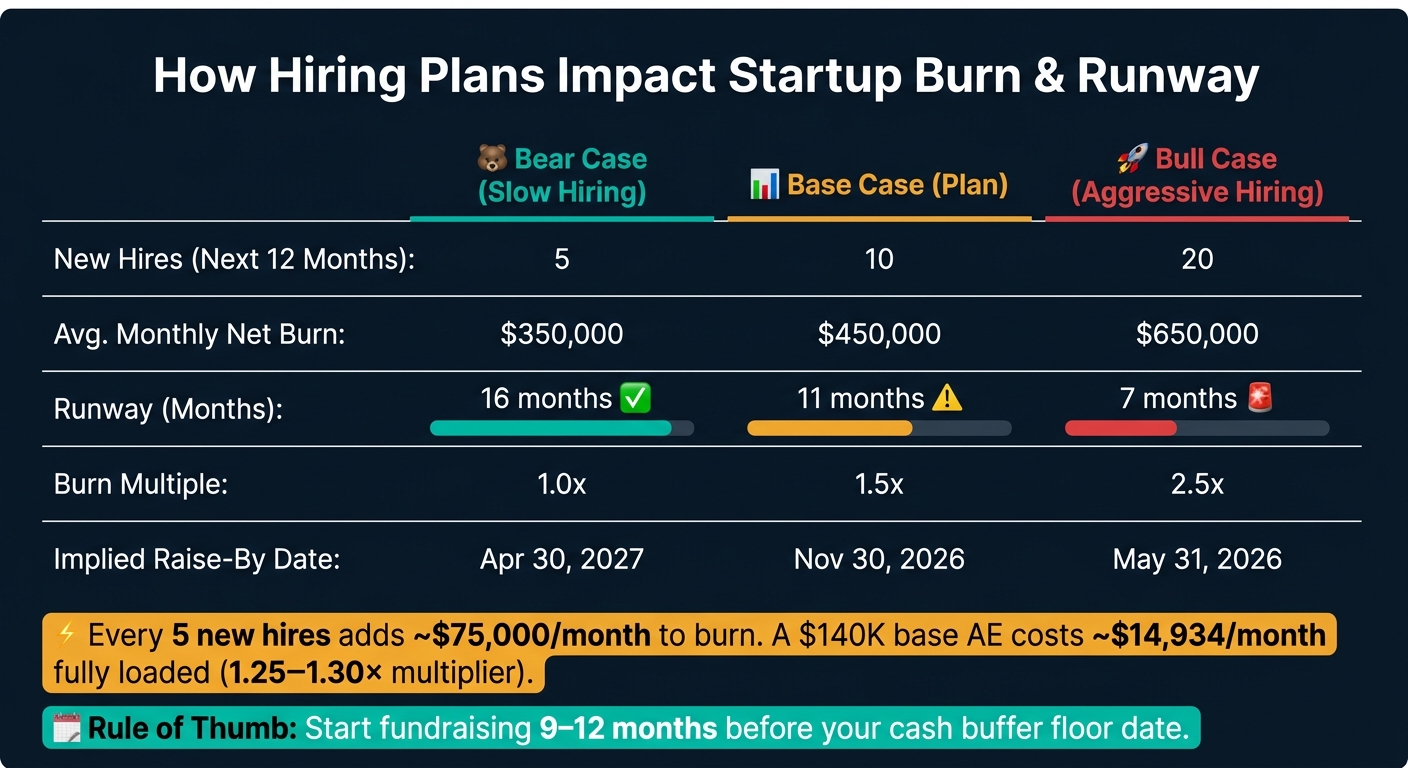
Startup Burn & Runway: Hiring Scenarios vs. Cash Runway
Once you have a clean operating burn number each month, the next step is turning it into a repeatable management system. One burn calculation helps. A steady cadence is what keeps a company from drifting off plan.
As runway gets shorter, tighten the rhythm. With 24+ months of runway, a monthly close, a 12- to 18-month rolling cash forecast, and a quarterly scenario review are enough. For 12–24 months, add monthly board-ready burn and runway reporting with variance analysis against budget, plus bi-weekly internal check-ins on hiring commitments, open offers, and sales performance.[21][20]
When runway drops below 12 months, switch to weekly internal cash checks. Keep it short: starting cash, expected inflows and outflows, and an updated runway view. At that point, you should also run a 13-week rolling cash forecast and share it with founders and key leaders.[18][19]
Finance should own the forecast. Founders should review it monthly. Department heads should refresh hiring and spend assumptions each quarter.[21][20] That cadence turns burn from a finance metric into a live operating dashboard.
Your dashboard should fit on one page. Pull the numbers from accounting, payroll, billing, and bank data, then reconcile each line to the month-end close.
At a minimum, track these fields each month:
| Field | What It Tells You |
|---|---|
| Starting cash | Where you began the month |
| Ending cash | Where you finished |
| Gross burn | Total operating cash outflows |
| Net burn | Gross burn minus operating cash inflows |
| Runway (months) | Ending cash ÷ trailing 3-month average net burn |
| Minimum cash buffer | Your floor, such as $500,000 or 3 months of payroll |
| Burn multiple | Net burn ÷ net new ARR, or another growth metric for your model |
| Raise-by date | When cash reaches your buffer floor at current burn |
For board reporting, put the core numbers - ending cash, runway, burn multiple, and raise-by date - at the top of the page. Show the monthly trend right below them. And don’t treat the raise-by date like a passive reporting line. Tie it straight to hiring approvals and fundraising timing.
The raise-by date is one of the most important fields on the dashboard. Most founders should begin raising 9–12 months before that date.[24][16]
Once the dashboard is up to date, connect it straight to headcount and collections timing.
Every planned hire changes gross burn. A sales AE with a $140,000 base salary costs about $14,934 per month fully loaded; five hires add roughly $75,000 to monthly burn.[15][17] That kind of shift can pull your raise-by date forward fast.
Build a headcount tab in your model with every current and planned role by department, base salary, start date, and fully loaded cost. A standard 1.25–1.30× multiplier on base salary covers benefits, payroll taxes, and overhead.[15][17] Link that tab straight to your monthly burn forecast so a change in start date flows through to runway and the raise-by date on its own.
Collections timing matters just as much. A customer who pays annually upfront helps net burn in the month of signing. A monthly pay-as-you-go customer spreads that cash out over time. If DSO slips from 30 to 60 days, net burn goes up even if bookings stay flat. That’s why it helps to stress-test hiring and collections together and see how each path changes runway and raise timing.
| Metric | Bear (Slow Hiring) | Base (Plan) | Bull (Aggressive Hiring) |
|---|---|---|---|
| New hires (next 12 months) | 5 | 10 | 20 |
| Avg. monthly net burn | $350,000 | $450,000 | $650,000 |
| Runway (months) | 16 | 11 | 7 |
| Burn multiple | 1.0 | 1.5 | 2.5 |
| Implied raise-by date | 04/30/2027 | 11/30/2026 | 05/31/2026 |
Set trigger points ahead of time, like moving from Base to Bear hiring if the Q2 plan is missed.[22][23]
Once the forecast starts shaping board decisions, finance bandwidth can become a bottleneck too. If the internal team is stretched thin, outside advisory support can help keep the forecast, hiring model, and board package current.
Even disciplined teams can get burn and runway wrong when the model or board package rests on weak assumptions. These issues are easy to miss, and they usually start in the forecast model.
The four most common model failures are:
Once the model is built, the next problem is presentation. A solid forecast can still create confusion if the board package doesn't spell out what the numbers mean.
Board reporting mistakes usually come down to three simple rules:
| Mistake | Risk | Corrective Practice |
|---|---|---|
| Runway reported without stating gross or net burn | Board misjudges cash safety; inflows may or may not be included | Label runway as based on net burn or gross burn; show both for clarity |
| Burn calculated using only last month's result | One-off items distort the metric and can push the board toward overreacting | Use a trailing 3-month average and show the last 6 months of trend |
| Only one forecast scenario presented | Board lacks visibility into downside risk and may under-prepare for delays | Present base, downside, and upside scenarios with runway months and raise-by dates |
| Cash metrics not reconciled to financial statements | Questions about data quality; errors go undetected | Reconcile bank balance to forecasted ending cash and tie burn to the operating section of the cash flow statement |
| Key assumptions not disclosed (DSO, hiring plan, pricing) | Board decisions are made on misunderstood inputs | Summarize key assumptions on one slide and update them each meeting |
When the model or reporting package gets too complex for the internal team, outside support can help. Phoenix Strategy Group provides bookkeeping, fractional CFO, and FP&A support for growth-stage companies.
Once your monthly model is set up, the habit matters more than the math. Burn and runway work best when they become part of how the company runs. Close the books every month, update the forecast with current assumptions, and review the numbers with leadership in a recurring operating meeting.
Use one shared definition of gross burn, net burn, and runway across the finance team, CEO, and board. That way, board discussions stay on the same numbers instead of getting sidetracked by shifting definitions.
It also helps to add burn multiple to the runway view as a capital-efficiency check.
When teams track these numbers month after month, leadership gets time to act before commitments are locked in.
If this process starts slipping because the team is stretched thin, outside help can keep everything current. If internal capacity is tight, Phoenix Strategy Group can help build the forecast, reporting cadence, and board-ready scenario model.
Gross burn is the total cash your company spends each month before you factor in any revenue. Net burn is the cash you lose each month after subtracting the cash collected from customers.
Because net burn shows how much cash is actually leaving the business, it’s the main number used for runway calculations and for board or investor reporting.
A 3-month trailing average for net burn gives boards a steadier view of runway because it smooths out month-to-month swings from uneven cash activity.
A single month can look much better or much worse than normal if it includes a one-time spike, an upfront payment, or a seasonal shift. Looking at the last three months as an average helps finance teams show the underlying pattern and avoid overreacting to short-term noise.
Hiring plans can move a startup’s raise-by date in a big way. The reason is simple: every new hire adds monthly cost right away, while the payoff usually comes later. Salaries, benefits, payroll taxes, equipment, and recruiting spend hit the budget now. Revenue from those hires often takes time to show up. That gap pushes burn up and cuts runway down.
Because of that, finance teams don’t look at past burn alone. They model runway using planned hiring scenarios too. In plain English, they ask: what happens if we hire as planned over the next few months? How much cash goes out before those people are fully ramped? Those forecast cases help set the fundraising trigger date.
A common target is to start the raise when the company still has about 9–12 months of runway remaining. That gives the team time for outreach, meetings, diligence, and the back-and-forth that can stretch longer than anyone wants.