Published on
September 7, 2026


If you want fewer trades and a steadier portfolio, I’d lean toward a 12-month signal. If you want faster shifts and can handle more trading, I’d look at a 6-month signal.
Here’s the short answer:
Put another way: this is less about which signal “wins” more often and more about which one fits how I run money. A signal can be right on direction and still fall short after commissions, slippage, and market impact.
| Factor | 12-Month Signal | 6-Month Signal |
|---|---|---|
| Lookback period | 12 months | 6 months |
| Reaction time | Slower | Faster |
| Noise level | Lower | Higher |
| Turnover | Lower | Higher |
| Trading costs | Lower | Higher |
| Whipsaw risk | Lower | Higher |
| Best fit | Core portfolio use | Tactical portfolio use |
My takeaway: 12-month momentum is usually the simpler choice for steady portfolio management. 6-month momentum can work too, but only if I can stay disciplined and the expected return per trade is high enough to clear costs.
That’s the whole issue in plain English: pick the window that matches your risk limits, cost tolerance, and how closely you can watch the portfolio.
The 12-month signal filters out a lot of short-term noise and leans into medium-term trends that have been in place for a while. In plain English: it usually gives you a steadier read and leads to less turnover.
When a sector or asset class has been gaining strength over several quarters, a 12-month signal can spot that pattern without getting pushed around by brief price swings. That makes it a good fit for diversified equity portfolios that prefer steady rebalancing instead of frequent shifts.
For owners who want steadier allocations and fewer portfolio changes, this window lines up well with lower-churn risk goals. That's the big upside. The downside is simple: when market leadership changes, the signal often reacts more slowly.
The tradeoff is that when leadership shifts quickly, a 12-month signal can be slow to adjust [1]. It remains tied to a longer run of past winners, even after newer leaders start moving ahead.
Lower turnover reduces commissions, exchange fees, slippage, and market impact. That's most useful when turnover, taxes, and slippage matter more than speed.
At the same time, the slower reset can leave the portfolio exposed for longer when leadership changes. And that can make interim drawdowns deeper.
The next window gives up some of this stability in exchange for faster adjustment.
The 6-month window gives up some stability in exchange for speed. When market leadership starts to change, this setup can react sooner.
Use a 6-month lookback when you want faster rotation and a more tactical allocation. It’s a better fit when the goal is to move with shifts in leadership instead of waiting for a longer trend to settle in.
That speed comes with a cost: higher turnover. And higher turnover can mean more commissions, more slippage, and more market impact [1].
Short lookbacks also tend to be noisier. In plain English, brief moves are more likely to turn into whipsaws. So even if the signal points in the right direction, timing can still work against you, especially during reversals [1].
There’s also the cost problem. A signal can be directionally right and still lose money if the move isn’t big enough to cover round-trip costs [1].
These tradeoffs stand out more clearly in the side-by-side comparison below.
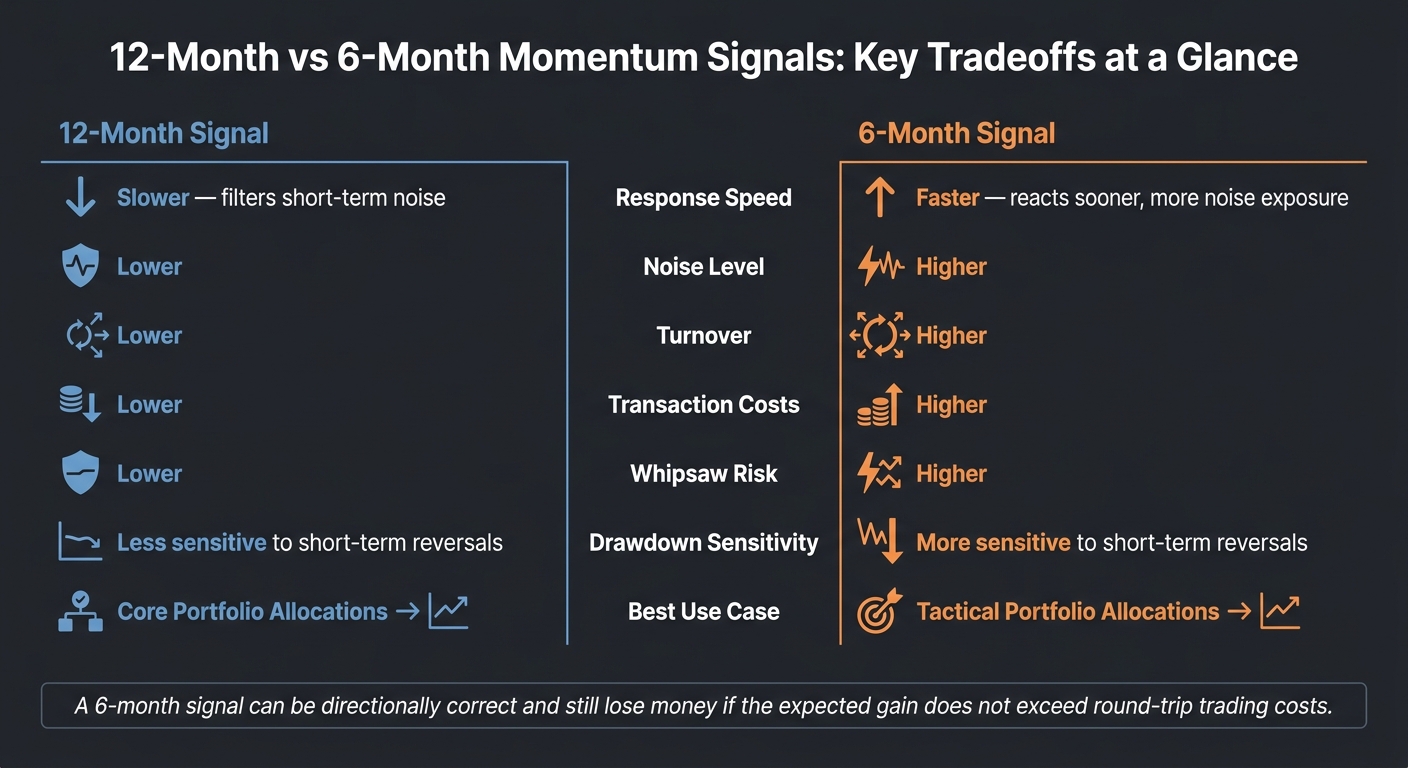
12-Month vs 6-Month Momentum Signals: Key Tradeoffs at a Glance
These two windows mainly differ in speed, noise, turnover, and cost. Here’s the tradeoff at a glance.
| Dimension | 12-Month Signal | 6-Month Signal |
|---|---|---|
| Response speed | Slower; captures longer-term momentum and filters short-term noise [1] | Faster; reacts sooner but more exposed to noise and reversals [1] |
| Turnover | Lower [1] | Higher [1] |
| Transaction costs | Lower [1] | Higher [1] |
| Drawdown risk | Less sensitive to short-term reversals [1] | More sensitive to short-term reversals [1] |
| Best use case | Core allocations | Tactical allocations |
A 6-month signal can be right and still lose money if the move doesn’t cover round-trip trading costs. That’s the catch. For higher-turnover signals to add value, the expected gain has to clearly exceed those costs [1].
For business owners, the better choice comes down to how much trading activity your portfolio can handle. Put simply: how much monitoring do you want this to take?
If you want a steadier allocation with lower turnover and less sensitivity to short-term noise, a 12-month momentum window will usually be the better fit. It works well as a core position and is less likely to call for frequent changes.
If you want a more tactical approach and can check the portfolio more often, a 6-month signal can make sense. But the math still matters. The expected move needs to be large enough to cover trading costs. If not, even a correct signal may not add value [1].
This gets very practical once you match the signal window to the job it plays in the portfolio. A 12-month window fits steadier, lower-turnover portfolios. A 6-month window fits more tactical portfolios that can handle higher trading activity. The choice depends on your risk tolerance, turnover budget, and rebalance cadence.
The tradeoffs are straightforward. Your best choice depends on how fast you want the portfolio to react, how much turnover you can handle, and how closely you can watch it.
A 12-month window works well for portfolios that put stability first. It usually leads to lower turnover, which can help keep trading costs down. It also makes sense when taxes, liquidity limits, or both matter more than reacting fast.
The downside is simple: it adjusts more slowly when market leadership changes. If the market turns in a hurry, this approach may lag.
A 6-month signal makes more sense for tactical portfolios that can handle more turnover and more frequent check-ins. It asks for steady execution. You need to follow your rebalance rules without second-guessing them every time markets get noisy.
There’s also a cost hurdle. The gain you expect from each trade needs to be higher than commissions, slippage, and market impact. If it isn’t, the extra activity can eat into results.
Here’s the short version:
Pick the window that lines up with your risk tolerance, liquidity needs, tax burden, and monitoring capacity. For growth-stage owners, that means matching the window to cash-flow sensitivity, tax drag, and how often you can rebalance.
A monthly rebalancing schedule is usually a good fit for momentum signals because it can improve risk-adjusted returns.
If you rebalance too often, trading costs can pile up. It can also trigger tax consequences that eat into returns. Using wider bands of ±10% to 15% may also help you avoid forced sales during short-term market swings.
Yes. Using both 6-month and 12-month momentum can give you a better read on what’s going on.
The 6-month view picks up recent changes. It’s more sensitive, so it can flag shifts sooner.
The 12-month view takes a step back. It smooths out some of the short-term noise and gives you a steadier sense of trend direction.
Put them together, and you get a mix of short-term signal and longer-term context. That can help you see whether momentum is building, fading, or just drifting sideways. It also makes it easier to tell the difference between a brief move and a change that may have more staying power.
Taxes can have a big effect on which momentum window works better in practice.
Shorter windows usually mean more turnover. And more turnover often means more short-term capital gains, which are taxed at ordinary income rates. That can take a bigger bite out of returns.
Longer windows can make it easier to hold positions for more than one year. When that happens, gains may qualify for long-term capital gains rates, which are often lower.
Frequent rebalancing brings another cost too: trading friction and tax drag. Together, they can cut annual returns by 0.8% to 1.2%. That may not sound huge at first, but over time it adds up.
A few tools can help keep that impact in check:
Put simply, the “better” momentum window on paper may not be the better one after taxes and costs hit the account.