Published on
August 4, 2026

If you make fewer than 1,000 parts a year, additive manufacturing often wins. If you make 10,000 to 50,000, tooling-based methods often start to win on unit cost. At 250,000+, they usually win by a lot.
That’s the short answer.
When I look at additive manufacturing against CNC machining, injection molding, and casting, I wouldn’t stop at part price. I’d look at:
The core tradeoff is simple:
If I had to reduce the whole article to one rule, it would be this: use AM when volume is low, design changes are likely, or spare-parts demand is uncertain; move to tooling only when demand and design are stable enough to pay back the upfront spend.
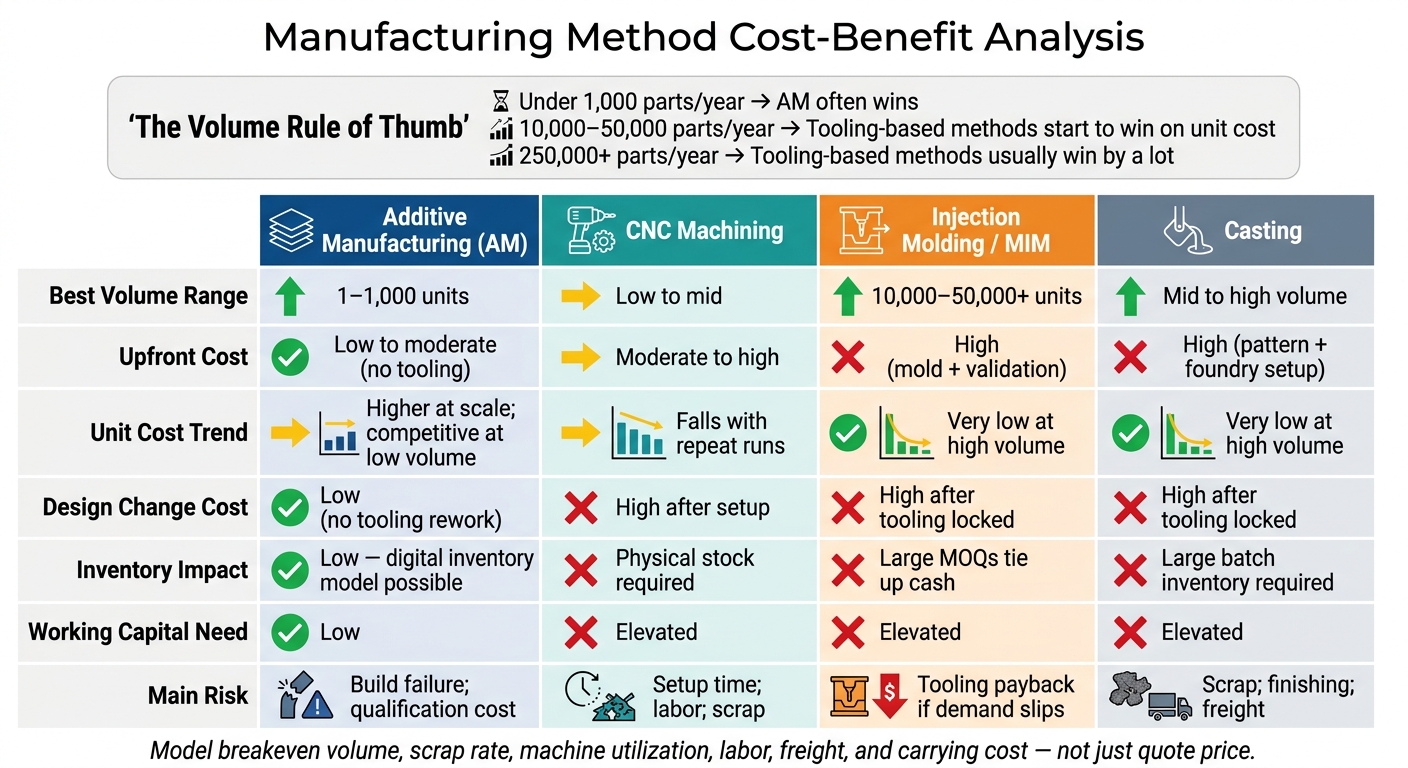
Additive Manufacturing vs. CNC vs. Injection Molding vs. Casting: Cost-Benefit Comparison
| Method | Best Volume Range | Upfront Cost | Unit Cost Trend | Design Changes | Inventory Impact | Main Risk |
|---|---|---|---|---|---|---|
| Additive Manufacturing | 1 to 1,000 | Low to mid | High at scale, better at low volume | Low cost to change | Lower physical stock | Build failure, qualification cost |
| CNC Machining | Low to mid | Mid to high | Falls with repeat runs | Costly after setup | Physical stock required | Setup time, labor, scrap |
| Injection Molding / MIM | 10,000 to 50,000+ | High | Low at volume | High cost to change | Large MOQs tie up cash | Tooling payback if demand slips |
| Casting | Mid to high | High | Low at volume | High cost to change | Large batch inventory | Scrap, finishing, freight |
So if you’re building a finance case, I’d model breakeven volume, scrap rate, machine use, labor, freight, and carrying cost - not just quote price. That’s where the decision usually changes.
One of the biggest financial upsides of AM is simple: no tooling. In low-volume programs, that alone can make AM the lower-cost option before the first part even ships. That said, an AM setup still comes with real upfront spend. A full AM cell needs printers, post-processing equipment, peripherals, and software for design and workflow management [1][2].
Day-to-day costs can add up fast too. Metal powders, machine time, labor for operation and post-processing, maintenance, inspection, and qualification and validation protocols all push costs higher, especially in regulated fields like aerospace and medical [1][2]. That’s why finance teams can’t stop at unit price. They need to look at the total landed value: tooling avoidance, assembly labor, inventory, freight, and validation costs.
That fixed-cost edge helps only when throughput stays steady and scrap doesn’t get out of hand.
Throughput looks very different depending on the process. Laser powder bed fusion (LPBF/SLM) is slower and needs more post-processing, but it fits high-density critical parts well. Binder jetting moves faster and works better for serial production, though teams still need to control shrinkage and part qualification [2].
Scrap and failed builds are a major cost risk. With AM, distortion and shrinkage can ruin an entire build, not just one part. That’s why many manufacturers now use in-situ monitoring and closed-loop quality control to catch defects before a full build fails [1][2]. For finance teams, QA infrastructure should be treated as a direct line item in the business case, especially in regulated sectors where powder traceability, documented process windows, and repeatable inspection records are required [1][2].
Once production is stable, inventory often becomes the next big cost lever. A digital inventory model, where CAD files stand in for physical stock, can cut inventory exposure and warehouse costs for spare parts. This is especially useful for obsolete or hard-to-source components [1][2]. Localized or nearshore AM production can also reduce transportation costs and lower supply chain interruption risk [1].
On-demand production helps trim safety stock and shorten procurement cycles. Part consolidation can also reduce fasteners, assembly labor, and sub-component inventory [2].
The table below sums up the main financial tradeoffs.
| Financial Dimension | AM Profile |
|---|---|
| Upfront Capex | Low to moderate (no tooling required) |
| Per-Part Cost | Higher at scale; competitive at low volumes |
| Inventory Carrying Cost | Reduced via digital inventory model |
| Freight Exposure | Lower with localized or nearshore production |
| Design Change Cost | Low (no tooling rework) |
| QA & Qualification Cost | High in regulated sectors |
CNC machining comes with a different cost shape. Compared with AM, CNC usually asks for more money at the start, then can drive down the cost per part once production settles into a steady rhythm. That early spend covers the machine, tooling, fixturing, programming, and setup before repeat production begins [2].
There’s a catch: once setup is done, design changes get expensive fast. They can also slow production. For fractional CFOs and finance teams, that puts the focus on one simple issue: will the upfront setup bill be paid back through lower part costs at scale?
Labor also plays a big part here. CNC needs skilled operators for setup, programming, and inspection, and that labor spend is a meaningful part of the cost per part [2].
Once a CNC program is dialed in, the economics can look strong. The main pressure point is setup time. If setup takes a long time compared with the actual machining time, short production runs can get expensive in a hurry.
Scrap and rework push costs up too, so process control still matters. As volume goes up, unit cost tends to come down because the setup cost is spread across more parts [2]. That’s why CNC tends to work best when demand is steady and change orders don’t keep popping up.
CNC depends on physical raw material, work-in-process, and finished-goods inventory. So working capital and warehouse costs usually stay higher than with AM. Put plainly, cash stays tied up longer.
Freight doesn’t go away either. Parts still need to be moved physically, and that keeps shipping tied to the cost picture.
| Financial Dimension | CNC Machining Profile |
|---|---|
| Upfront Capex | Moderate to high: machine, tooling, fixturing, programming |
| Per-Part Cost | Competitive at high volumes; expensive at low volumes |
| Inventory Carrying Cost | Higher; physical stock is required |
| Design Change Cost | High after tooling is finalized |
| Working Capital Need | Elevated because inventory and setup costs are paid upfront |
CNC fits best when designs stay fixed and volume is high, but it still locks up more working capital than AM. In that sense, CNC is the baseline manufacturing process for stable designs before putting it side by side with more tooling-heavy methods.
Injection molding changes the math again: higher upfront tooling, lower per-part cost once volume climbs.
With metal injection molding (MIM), a big share of the spend lands before the first production part ever ships. Mold design, tooling fabrication, and validation all hit the balance sheet early. That means MIM makes sense only when demand is steady enough to spread tooling cost across a large run.
For finance teams, the tradeoff is pretty straightforward: spend more now to cut unit cost later.
There’s another catch. Design changes get expensive once tooling is locked. Compared with AM, where geometry updates are faster and cheaper to handle, mold changes bring delay and rework cost [2].
Once the mold is validated and production is up and running, MIM can deliver steady throughput. That repeatability helps trim inspection and post-processing spend. After validation, MIM also supports consistent output with less post-processing than AM.
After throughput stabilizes, inventory becomes the next big cost lever.
MIM often comes with large MOQs. That ties up cash in inventory and pushes carrying costs higher. If demand is uncertain or the product lifecycle is short, that working capital burden can get heavy fast.
Offshore tooling or production adds another layer: more freight cost and longer lead times. In plain terms, cash stays tied up longer before it comes back.
| Financial Dimension | Injection Molding Profile |
|---|---|
| Upfront Capex | High; mold design, tooling, and validation required before production |
| Per-Part Cost | Very competitive once volumes are high; weaker at low volumes |
| Design Change Cost | High after tooling is finalized |
| Inventory Carrying Cost | High; large MOQs tie up working capital |
| Working Capital Need | Elevated; tooling spend and batch inventory both hit cash early |
MIM ROI depends heavily on volume and design stability. If demand softens or the design shifts, tooling payback weakens fast [2]. That’s why MIM is often the clearest benchmark for tooling-amortized production cost.
Casting follows the same scale pattern as MIM, but yield and batch size play a bigger role in payback.
For finance teams, casting is a capex-heavy, volume-driven process. Tooling payback depends on steady demand and tight scrap control. Pattern fabrication, foundry setup, and mold development all need cash before production starts. That front-loaded spend only works when demand is predictable and the design is stable. Casting tends to fit mid- to high-volume programs. Below that range, tooling payback drops off fast.
Design changes are the other big risk. Once casting tooling is finalized, revisions get expensive and slow. That creates real exposure for programs where field requirements or customer specs are still moving [2].
Casting can deliver strong throughput at scale, but scrap risk needs to be part of the unit-cost model from day one. Shrinkage and distortion can drive scrap rates up, and finishing or inspection can chip away at the per-part cost edge.
For finance teams, that means scrap assumptions should sit in the base-case unit cost, not in a downside case you hope never shows up.
Casting usually comes with large minimum batch sizes, which ties up cash in inventory until the run is finished and shipped. Because casting leans on batch economics, small runs push unit cost higher.
Freight is another pressure point. Casting often depends on centralized foundries, which can mean longer shipping distances and less room to produce closer to the end customer [1]. The result: higher logistics cost and longer lead times.
| Financial Dimension | Casting Profile |
|---|---|
| Upfront Capex | High; pattern fabrication, tooling, and foundry setup required |
| Per-Part Cost | Very competitive at high volumes; weaker at low volumes |
| Design Change Cost | High after tooling is finalized |
| Inventory Carrying Cost | High; large batch sizes required to amortize tooling |
| Working Capital Need | Elevated; tooling spend and batch inventory both hit cash early |
Casting ROI depends on stable demand, locked design, and low scrap [2]. When volume is high and the design is locked, the unit economics can be hard to beat. But if either condition slips, the financial case weakens fast.
For programs with uncertain demand or frequent design iterations, a staged path often makes more sense: start with AM for bridge production, then reassess for casting once forecasts settle down [2].
These tradeoffs feed directly into the method-by-method summary below.
Each manufacturing method has its own money story. Some look great at low volume but get expensive as output climbs. Others need a big upfront spend, then pay off once production is steady. The best pick comes down to three things: volume, how stable the design is, and how much upfront capital the program can take.
The table below pulls together the six finance variables used across this article: capex, throughput, defect rates, inventory, freight, and working capital.
| Manufacturing Method | Key Financial Strengths | Key Financial Weaknesses | Best Economic Fit |
|---|---|---|---|
| Additive Manufacturing (AM) | Near-zero tooling cost; low material waste on successful builds; fast design iteration; short lead times | Higher unit cost as volume grows; slower throughput at scale | Prototypes, complex geometries, volumes under 1,000 units [2] |
| CNC Machining | No mold costs; high precision on simple-to-medium parts | High material waste; higher labor cost per part | Finishing AM parts; low-volume precision components |
| Injection Molding / MIM | Lowest unit cost at high volume; high throughput; repeatable surface finish | High upfront tooling; expensive design changes after tooling | Stable, high-volume programs above 10,000 units [2] |
| Casting | Competitive unit cost at volume; good for large structural parts | Higher defect rates; large batch inventory requirements | Mid-to-high volume programs with locked designs |
In plain English, AM tends to win when part geometry is hard, designs may still change, or volumes stay low. You avoid tooling costs, move faster, and don't get boxed in early.
MIM and casting are a different bet. They make more sense when demand is stable and high enough to spread tooling cost across a lot of parts. That's where their lower per-unit cost starts to matter.
CNC machining sits in the middle. It's useful when you need precision without paying for molds, but the cost per part and material scrap can add up fast.
The conclusion turns these tradeoffs into a simple finance decision rule supported by fractional CFO insights.
Cost alone doesn’t decide this.
The real issue is whether AM’s upside - lower inventory, lower freight, and less working capital tied up - makes up for its higher per-unit cost and slower throughput for your program. And that edge gets smaller as volume goes up.
In most cases, AM wins at low volume. Tooling-based methods tend to win once volume is high enough to spread capex across more units. That’s why the next move isn’t a simple part-price check. It’s a break-even model.
For most growth-stage manufacturers, the best path is a staged strategy: use AM for launch and bridge production, gather real demand data, and commit to hard tooling only when volume and design are both stable [2].
To make that call with confidence, build a scenario model that looks at total landed value, breakeven volume, NPV, scrap, utilization, labor, freight, and carrying costs [2]. For growth-stage manufacturers, the answer comes from the numbers. Phoenix Strategy Group can build and stress-test that model.
Calculate AM break-even volume by finding the point where additive manufacturing’s total cost of ownership matches your other method or business goal. That means looking at the full cost picture, not just the print itself.
Include:
Then compare the AM unit cost at your target volume with the amortized tooling cost of other methods. This is where the math gets honest. A process with a low per-part cost can still lose at lower volumes if tooling is expensive up front.
It also helps to run sensitivity analysis. Change key variables like volume or material cost by 10% to 30% and see how the outcome shifts. A small swing in assumptions can move the break-even point quite a bit, especially when margins are tight.
Switch from additive manufacturing (AM) to conventional tooling when unit economics start to work in your favor at higher volumes. That shift usually happens once the design is stable and annual demand is easy to forecast, often starting at around 10,000 units.
A common path looks like this: use AM for prototyping, low-volume production, and fast iteration. Then, once lower per-part costs make sense, move to tooling and absorb the upfront investment.
Finance teams often miss indirect and operating costs that shape total cost of ownership. The machine price is only part of the picture.
You also need to factor in post-processing, quality inspection, certification, maintenance, software updates, and utilities. Those line items can add up fast, and they often show up after the purchase decision is already made.
There are other costs that matter just as much, even if they’re easier to overlook. These include:
Put simply, a lower sticker price doesn’t always mean a lower total cost.