Published on
August 24, 2026

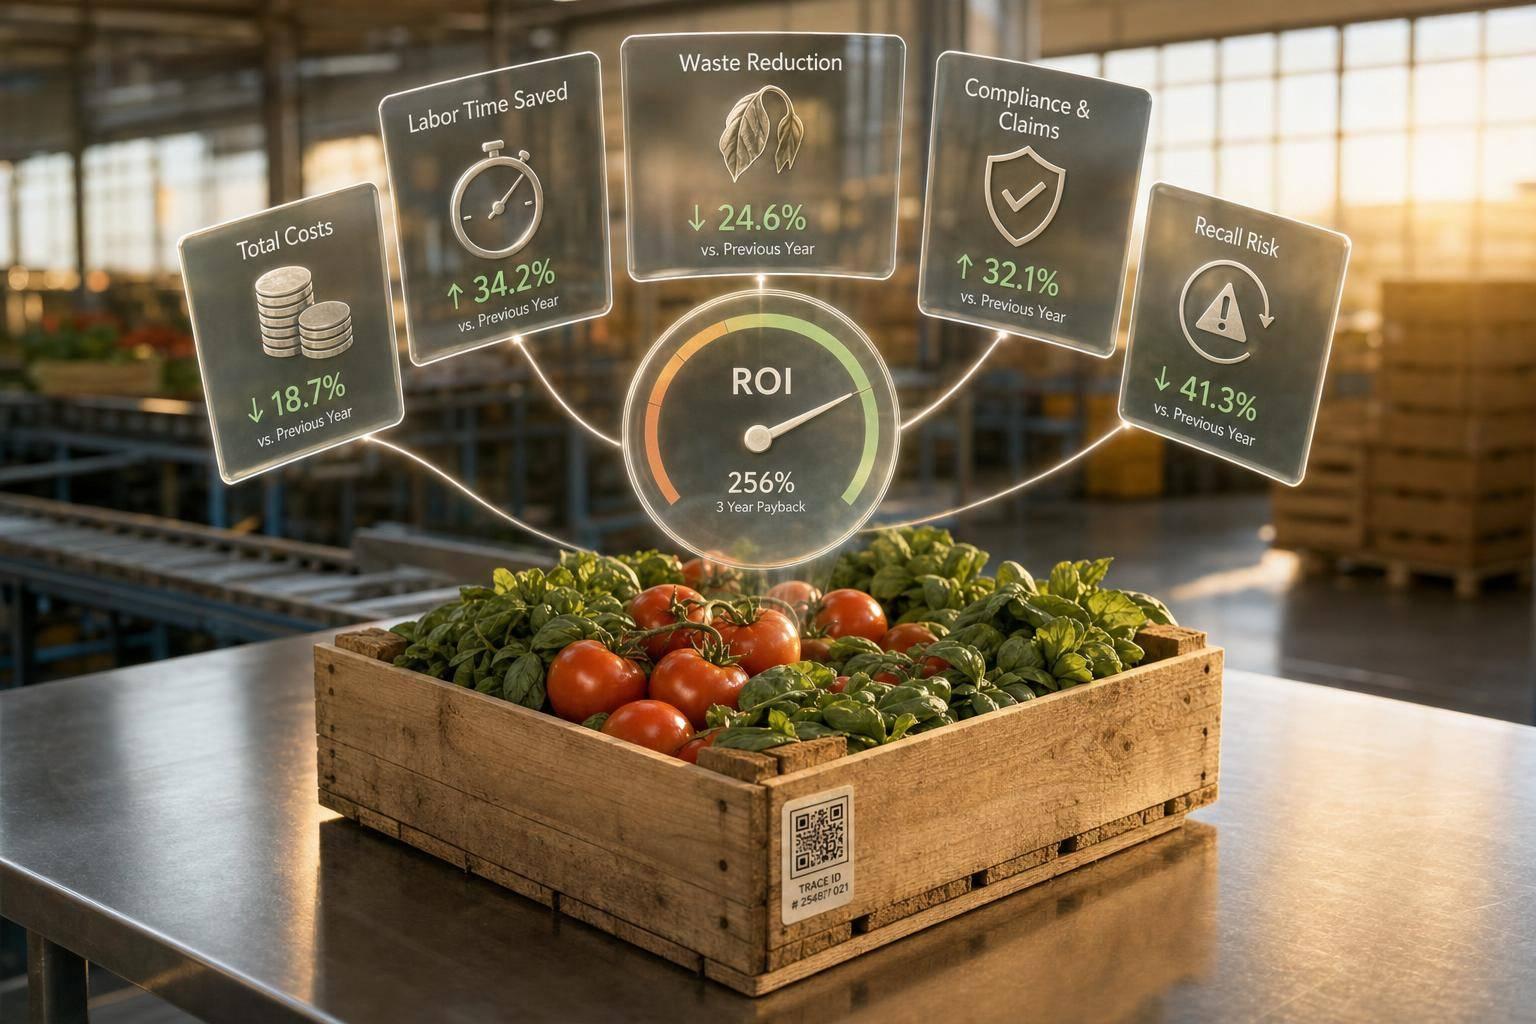
A traceability platform should pay for itself. If I were judging this purchase, I’d look at four numbers first: total cost, annual savings, payback period, and recall risk reduction.
Here’s the short version:
What I’d want in the model:
A short way to frame it: if I can show lower labor, lower waste, and tighter recall scope in dollars, I can make a clean case for the spend.
Once you define ROI, the next step is to break the return into five measurable levers: labor, claims, inventory, compliance, and recall exposure. Each one maps to a line on your P&L or a change in cash flow. Put together, they become the core inputs for your board model.
Manual traceability work eats up staff time. That usually shows up in data entry, reconciliation, audit prep, recalls, and record retrieval.
A simple way to estimate labor value is:
Hourly wage × hours saved per week × 52
For example, if a quality manager earns $38 per hour and saves 6 hours per week, that adds up to about $11,856 per year in direct labor value. That’s before you factor in lower overtime or moving that time into higher-impact work.
To make this number believable, don’t stop at base salary. Use fully burdened labor cost, and be clear about where the gain shows up:
SoftTrace documented a medium-sized dairy processor that automated data collection and recording and saved the equivalent of 2.5 people per production line, worth about $250,000 over 3 years.[5]
When a customer dispute comes in, the cost goes well beyond the product itself. You’re dealing with investigation time, freight, replacement product, and price credits. Lot-level traceability helps by giving your team a tight, auditable chain of custody.
A study of IBM Food Trust reported that supply chain dispute resolution dropped from 45 days to 7 days, and integrated traceability cut quality-control cost by 65%.[6] In plain terms, that can mean fewer unnecessary credits, faster root-cause work, and less margin loss on disputed orders.
For your model, treat this as average cost per claim before implementation versus after implementation, then convert that gap into annual savings.
That same visibility doesn’t just help with claims. It also helps reduce waste.
Lot-level visibility makes FIFO and FEFO easier to follow. That can reduce spoilage and write-offs while freeing up working capital that would otherwise sit in slow-moving stock.
The same IBM Food Trust case study found that inventory turnover increased by 23% to 6.4 turns per year, while food waste fell from 12.7% to 10.4%.[6]
To estimate the upside, track your shrink, spoilage, and write-off rates before and after rollout. Then look at two things:
Digitized records can cut documentation labor, consultant fees, and the time spent retrieving records or answering corrective actions. The math here is pretty direct: compare your current annual compliance labor and vendor spend with a realistic post-implementation baseline.
The difference goes into your ROI model as a direct reduction in operating expense.
Compliance savings tend to repeat year after year. Recall savings work differently because they’re based on risk.
Recall exposure should be treated as an expected annual loss, not as a sure thing. Start with the annual probability of a recall event, multiply it by the expected cost, and compare the pre-implementation and post-implementation values.
The Grocery Manufacturers Association and Food Marketing Institute estimate the average direct cost of a food recall in the U.S. at about $10 million, with many events going past $30 million once indirect effects are counted.[1][2][3][4]
Precise lot tracing can shrink the scope of a recall from an entire production day to a single run. That can cut disposal and logistics costs in a big way. It also gives leadership a cleaner view of risk.
Keep this category separate from day-to-day operating savings. It belongs in your model as risk-adjusted avoided loss, not guaranteed cash flow, so boards can judge it as risk reduction rather than booked savings.
Use these five levers as the line items in your founder-ready ROI model.
Take the five value drivers and turn them into a simple ROI model with costs, benefits, and scenario ranges. Keep the model easy to update so assumptions can change fast without breaking the whole sheet.
Start with total investment and split it into one-time and recurring costs. Put one-time items in Year 0. Put recurring items in future years.
That setup makes payback and steady-state economics much easier to see because you’re not mixing different time periods.
One-time costs usually include implementation, integration, data cleanup, training, change management, hardware, and customization. Recurring costs usually include subscription, support, hosting, maintenance, and internal admin time.
Use one formula for each of the five value drivers. Map each driver to one formula and one line item.
| Value Driver | Formula |
|---|---|
| Labor savings | (Hours per task before − after) × frequency × loaded hourly wage |
| Claim cost reduction | Baseline claims/year × avg. cost per claim × expected reduction rate |
| Spoilage/waste savings | Baseline spoilage cost × reduction percentage |
| Compliance labor savings | Hours eliminated × frequency × loaded hourly wage |
| Recall risk reduction | Avg. recall cost × (pre-implementation probability − post-implementation probability) |
Use your own historical data. If an input does not come from actuals, label it as an assumption. And if hours overlap, assign them to one bucket only. Otherwise, you’ll double count savings without meaning to.
Once each lever has a formula, run it through base, upside, and downside cases.
Three scenarios make the model board-ready. Keep price and cost assumptions fixed. Only change the operational inputs management can influence, such as:
Each scenario should produce four outputs: annual net benefit, cumulative cash flow, payback period, and EBITDA impact.
For even annual cash flows, the payback formula is total one-time costs ÷ annual net benefit. For uneven cash flows, use the last negative cumulative year and the next year's inflow.[7][8]
Use the downside case to show what happens with slower adoption or no recall event.
Now translate operating gains into the numbers boards and investors care about: EBITDA, gross margin, and working-capital impact.
Labor and compliance savings reduce operating expense, so they flow straight to EBITDA. Lower spoilage and fewer claims improve gross margin. Better inventory turns reduce working capital by freeing up cash tied up in slow-moving stock.
There’s one catch: that cash-flow lift only appears when stock levels actually fall, not the day the system goes live.
Report EBITDA impact and cash timing separately. That keeps the model clean and makes the financial story much easier to defend.
Once the ROI model is built, the next job is turning it into a board-ready story. That means payback, EBITDA impact, and risk reduction. Not a long tour of the model. Not a spreadsheet dump. Just the few numbers that help people decide.
Boards don’t want every input. They want the handful of metrics that show whether the investment is paying off. A tight scorecard usually lands better than a giant spreadsheet. The core metrics are annual ROI %, payback period (in months), annual labor savings, compliance hours saved, inventory turn improvement, claim cost reduction, and estimated recall exposure reduction.[10][11]
For each one, show three things:
That structure makes the story easy to follow. It shows cause and effect, not just output. For example, audit prep time may have dropped from 160 hours per audit to 40 hours. That’s a 75% reduction, worth $18,000 in annual savings. A board can look at that and immediately see what changed and why it matters.
Treat recall exposure reduction differently. Report it as a probability-weighted board metric, not as a booked saving.
Use those metrics to shape the three-slide update.
Keep it to three slides: investment and payback, operating gains, and risk plus next steps.
Slide 1 should tie straight to TCO and payback. Show total dollars spent across the platform, implementation, and internal time. Then show current annual net benefits, annual ROI %, and payback period. A clean example looks like this: $280,000 total investment, $210,000 annual net benefits, 75% annual ROI, and 16-month payback. The board-level issue is simple: does the investment clear payback and return targets?
Slide 2 should focus on operating savings from the model. Pair those savings with operating proof points like mock recall time and supplier adoption rate. If mock recall time fell from 72 hours to 4 hours, that’s a 94% improvement. And that matters because it signals recall readiness before a real event hits.[9][11]
Slide 3 should cover modeled risk reduction and the next decision. Show the probability-weighted recall exposure reduction, current supplier adoption status, and a direct ask, such as approval for more data integrations or the next module rollout. Put the technical detail in the appendix, where it belongs.
This is the part where teams either build trust or lose it.
Label booked savings as realized. Label recall reduction as modeled downside. Keep the same scenario ranges used in the model, and show them on the risk slide. Then connect those ranges to plain operating changes, like faster mock recalls or better supplier data completeness.
That framing shows discipline. It tells the board what is realized, what is modeled, and what decision is being requested.
If Phoenix Strategy Group has validated the model and data pipelines, note that in the appendix.
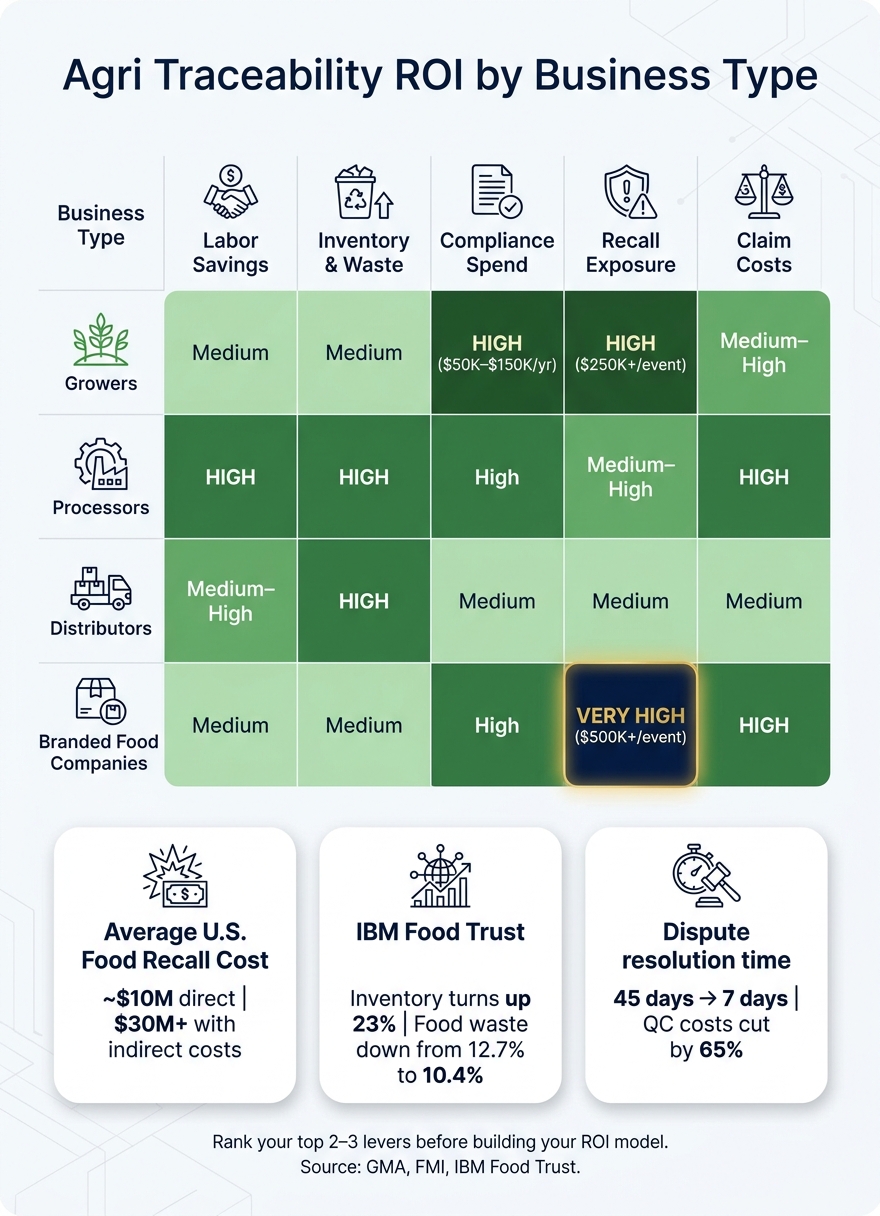
Agri Traceability ROI by Business Type: Key Value Drivers
Traceability ROI doesn’t look the same for every business. Your model matters. So before you build anything, rank the two or three levers most likely to move the needle for your operation.
| Business Type | Labor Savings | Inventory & Waste | Compliance Spend | Recall Exposure | Claim Costs |
|---|---|---|---|---|---|
| Growers | Medium | Medium | High ($50,000–$150,000/year) | High ($250,000+/event) | Medium–High |
| Processors | High | High | High | Medium–High | High |
| Distributors | Medium–High | High | Medium | Medium | Medium |
| Branded Food | Medium | Medium | High | Very High ($500,000+/event) | High |
The pattern is pretty clear. Growers should start with compliance spend and recall risk. Processors usually get the most from labor savings and lower waste. Branded food companies should focus first on recall scope and claim costs.
After you rank those levers, lock in the baseline metrics that will feed your ROI model.
Start with these six metrics before you build the model:
If your finance team is stretched thin, Phoenix Strategy Group can build the baseline and turn it into investor-ready outputs.
Those baselines feed straight into payback, annual ROI, and risk reporting. Founders should walk away with payback, annual ROI %, gross margin impact, and probability-weighted risk reduction. Then report those numbers every quarter, with the two or three levers that matter most for your business type front and center.
Use ROI (%) = [(Total Annual Savings - Total Investment Costs) / Total Investment Costs] × 100.
Start with your current costs: manual labor, audit costs, and incident losses. That gives you a clean baseline. If you skip this step, the math can look good on paper but feel shaky in the boardroom.
For investment costs, include the full spend:
It also helps to split savings into two buckets: realized cash savings and avoided costs. That distinction matters. Realized cash savings show money that no longer goes out the door. Avoided costs show losses or future spend you sidestepped, like fewer incidents or lower audit effort.
For board reporting, use a 5- to 10-year cash flow model that shows both upfront costs and recurring costs. In plain English, that means laying out what you pay at the start, what you keep paying each year, and when the savings begin to outweigh the spend.
Start with the highest-impact areas by auditing your current baseline. For traceability platforms, the main ROI drivers are:
For board or investor reporting, use a 5- to 10-year total cost of ownership model. Also separate realized cash savings from avoided costs so the picture is clear.
Show traceability ROI as a multi-year cash flow model, not just a simple cost-cutting pitch. That changes the conversation. Instead of saying, “This system will save money,” you’re showing when cash goes out, when cash comes back, and how much of that return is likely versus contingent.
Start by separating avoided costs from realized savings.
That distinction matters in the boardroom. Realized savings usually carry more weight because they hit the P&L more directly. Avoided costs still belong in the model, but they should be shown clearly and not blended in as if they’re guaranteed.
Use the standard ROI formula exactly as written:
[(Total Annual Savings - Total Investment Costs) / Total Investment Costs] × 100
But don’t stop there. A board-ready case also needs to show the cash flow behind the formula. In practice, that means laying out investment timing, ramp-up by phase, and the KPI changes that drive each line of value.
Include all investment costs, not just software fees. If the model leaves out internal effort or rollout friction, it won’t hold up under scrutiny.
Your cost base should usually include:
A simple way to make this easy to review is to split costs into one-time and recurring categories.
| Cost category | Year 0 | Year 1 | Year 2 | Year 3 |
|---|---|---|---|---|
| Software setup and integration | $180,000 | $0 | $0 | $0 |
| Hardware and infrastructure | $90,000 | $15,000 | $10,000 | $10,000 |
| Training and change management | $60,000 | $20,000 | $10,000 | $10,000 |
| Internal project labor | $120,000 | $40,000 | $25,000 | $25,000 |
| Subscription and support | $0 | $85,000 | $85,000 | $85,000 |
| Total investment costs | $450,000 | $160,000 | $130,000 | $130,000 |
That kind of view keeps the model honest. It also helps directors see that Year 0 and Year 1 often carry the heaviest outflows.
Next, define the baseline metrics that will drive cash flow over time. Keep this tight. If you track too many KPIs, the case gets muddy.
A solid set of 3–5 KPIs might include:
Each KPI should have a current baseline, a target state, and a clear cash effect. That’s the bridge between operating change and financial return.
| KPI | Baseline | Target by steady state | Cash flow effect |
|---|---|---|---|
| Recall containment time | 2 days | 4 hours | Lowers recall scope and disruption cost |
| Manual traceability labor | 2,400 hours/year | 900 hours/year | Cuts labor cost or frees labor for other work |
| Scrap/rework tied to lot visibility | 3.2% of volume | 2.4% of volume | Lowers waste and reprocessing cost |
| Inventory write-offs | $420,000/year | $280,000/year | Reduces write-offs and margin leakage |
| Expedited shipments from traceability gaps | $180,000/year | $75,000/year | Reduces freight premium |
This is where the model starts to feel real. You’re not claiming abstract value. You’re saying, for example, “If manual traceability work drops by 1,500 hours per year, at a loaded rate of $38/hour, that creates $57,000 in annual savings.” Clean. Defensible.
The next step is to convert those KPI shifts into annual dollars. And this is where many ROI cases fall apart: they assume full value on day one.
Don’t do that.
Use phased adoption assumptions instead. Most traceability programs ramp over time. A pilot site may go live first, then a second plant, then supplier onboarding, then full process compliance. The value curve should reflect that reality.
A common pattern looks like this:
That phased ramp makes the case more believable. It also gives finance and the board a better sense of timing.
Here’s a sample multi-year cash flow model using that logic:
| Cash flow item | Year 0 | Year 1 | Year 2 | Year 3 |
|---|---|---|---|---|
| Realized savings: labor reduction | $0 | $22,800 | $45,600 | $57,000 |
| Realized savings: scrap/rework reduction | $0 | $48,000 | $96,000 | $120,000 |
| Realized savings: lower inventory write-offs | $0 | $42,000 | $98,000 | $140,000 |
| Realized savings: less expedited freight | $0 | $31,500 | $73,500 | $105,000 |
| Avoided costs: reduced recall exposure | $0 | $40,000 | $85,000 | $120,000 |
| Total annual savings | $0 | $184,300 | $398,100 | $542,000 |
| Total investment costs | $450,000 | $160,000 | $130,000 | $130,000 |
| Net cash flow | -$450,000 | $24,300 | $268,100 | $412,000 |
That table does a few things at once. It shows the early cash burden. It shows the ramp. And it makes clear that some gains are operating savings while others come from risk reduction.
Once you have total annual savings and total investment costs by year, apply the ROI formula directly.
For example, in Year 2:
[($398,100 - $130,000) / $130,000] × 100 = 206.2%
In Year 3:
[($542,000 - $130,000) / $130,000] × 100 = 316.9%
You can also show cumulative cash flow if the board wants to know when the project moves into positive territory. That’s often as important as annual ROI.
| Measure | Year 0 | Year 1 | Year 2 | Year 3 |
|---|---|---|---|---|
| Net cash flow | -$450,000 | $24,300 | $268,100 | $412,000 |
| Cumulative cash flow | -$450,000 | -$425,700 | -$157,600 | $254,400 |
This tells a simple story: the project does not “pay back overnight,” but it crosses into positive cumulative cash flow during Year 3. That kind of pacing feels more believable than a model that claims instant gains.
A board-ready model needs clear assumptions, not hidden math. Spell out what must happen for the numbers to land.
For example:
The model assumes rollout to one site in Year 1, two additional sites in Year 2, and full network use in Year 3. Labor savings reflect a loaded hourly rate of $38. Scrap reduction is based on a 0.8-point drop tied to lot-level visibility and faster root-cause isolation. Recall exposure savings are probability-weighted and shown separately from realized operating savings.
That last point matters a lot. If avoided costs are probability-weighted, say so. If they’re scenario-based, say that too. Boards tend to push back when risk-adjusted numbers are presented as guaranteed cash.
A good model doesn’t try to win by using the biggest possible numbers. It wins by being believable.
That usually means: