Published on
August 5, 2026


If your finance team still runs forecasts and board reports in spreadsheets, AI can cut cycle time, clean up reporting, and improve forecast accuracy - but only if your data and controls are in place first.
I’d sum up the path like this:
A few numbers stand out. Finance teams can spend 50% of their time gathering data. Poor data quality can push that to 59%. AI-backed forecasting can shrink planning cycles from 18–25 days to 5–8 days, and stronger FP&A teams can keep forecast variance near 5% of actuals instead of 12%–15%.
Here’s the core idea: AI in FP&A is not about replacing finance judgment. It’s about cutting manual work, improving visibility, and giving you numbers you can use before the month is old news.
| Step | What I’d focus on | Main outcome |
|---|---|---|
| 1 | Data sources and data layer | Cleaner inputs |
| 2 | CoA mapping | One reporting structure |
| 3 | Driver-based forecasting | Better planning models |
| 4 | Workflow automation | Less manual close work |
| 5 | Approvals and audit logs | More control |
| 6 | Reporting rules and dashboards | One version of the numbers |
| 7 | Rollout and training | Team adoption |
Bottom line: if you want better runway visibility, faster reporting, and cleaner investor reporting, these seven steps give you a clear way to put AI into FP&A without losing control.
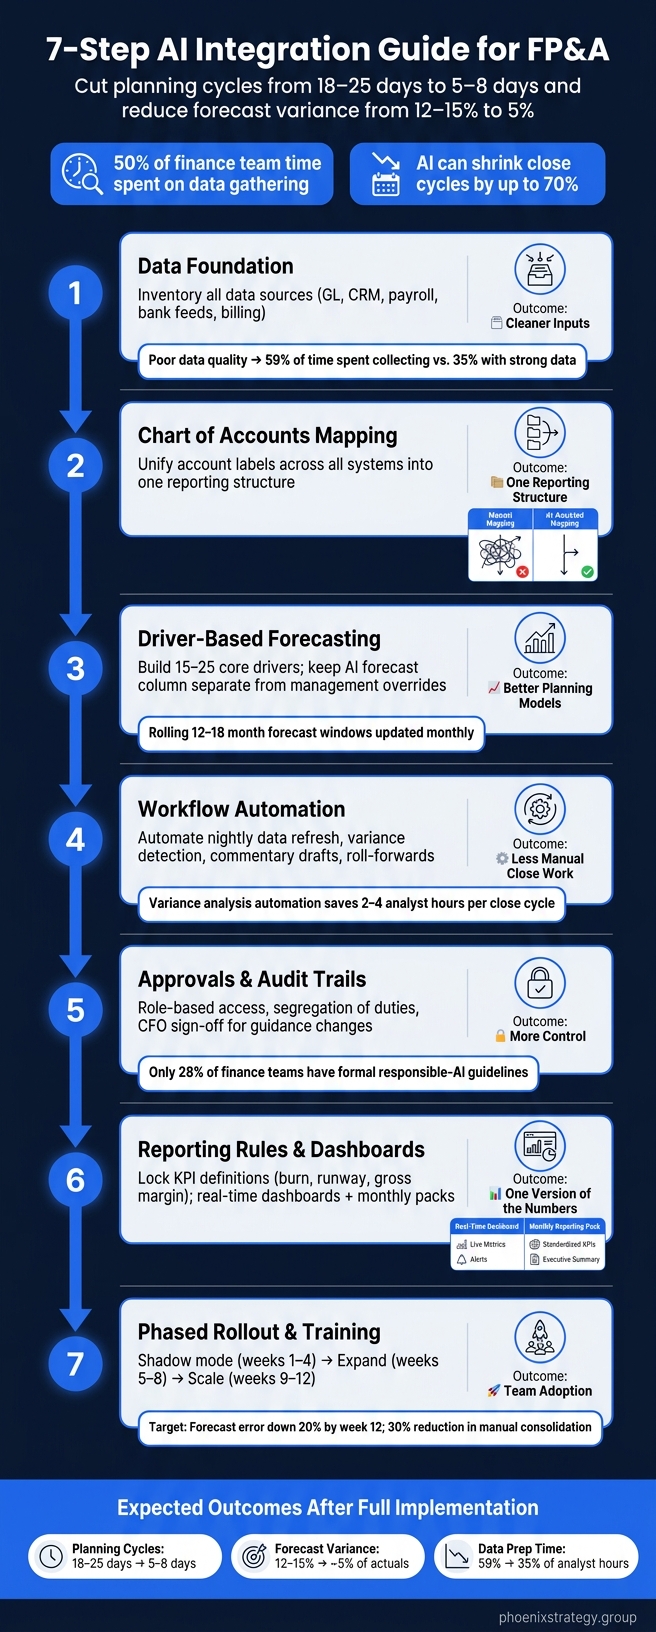
7-Step AI Integration Framework for FP&A Teams
FP&A teams spend nearly 50% of their time gathering and preparing data, which leaves far less time for actual analysis. Steps 1 and 2 are meant to cut that drag. Step 1 begins with the data layer.
Start by listing every system that feeds your FP&A work. For most U.S. growth-stage companies, that usually means six core categories: general ledger, revenue and billing, payroll and HRIS, CRM, bank feeds, and operational metrics.[3] If inputs are inconsistent across systems, AI can’t do much with them.
After you’ve listed the sources, set the same standards across all of them:
For data movement, begin with daily syncs for GL and bank data, daily or intra-day syncs for revenue and billing, and cycle-based payroll updates. Save real-time feeds for metrics that affect same-day decisions.[3]
The payoff here is pretty direct. Poor-quality data pushes teams to spend 59% of their time collecting and validating numbers, versus 35% for teams with strong data quality.[2] That’s a huge gap, and it shows up fast in planning cycles.
Ownership matters just as much as structure. Finance should own the GL and metric definitions. RevOps should own CRM pipeline completeness. HR should own employee and department data. Engineering should own the pipelines themselves. If no one is clearly on the hook, data quality slips little by little, and AI outputs stop being dependable.[3]
Once the data layer is in shape, the next job is to line up account names under one reporting structure.
Even after systems are connected, you still run into a basic problem: different tools use different labels for the same account. AI needs a mapping layer to bring that all together.
Build one target CoA that supports both management reporting and U.S. GAAP reporting. Use a consistent numbering scheme - 4xxx for revenue, 5xxx for COGS, 6xxx for operating expenses - and tag accounts with dimensions like department and product so reports can be sliced without rebuilding the structure.[4] When everything flows into one reporting structure, forecasts, dashboards, and actuals are much easier to tie out.
Here’s a side-by-side look at the two common mapping approaches:
| Approach | Strengths | Weaknesses | Best fit for |
|---|---|---|---|
| Manual spreadsheet mapping | High control; every mapping is finance-reviewed; easy to audit | Time-consuming; error-prone at scale; hard to maintain across multiple entities | Early-stage companies with one or two GL systems and a limited number of accounts |
| AI-assisted mapping | Fast across hundreds of accounts; learns from historical mappings; handles ongoing updates | Needs upfront configuration; can misclassify edge cases without finance review | Growth-stage firms with multiple entities, acquisitions, or complex revenue structures |
AI tools can help by scanning account names and descriptions - "Stripe fees", "AWS hosting", "Sales commissions" - and then suggesting mappings to target categories using pattern matching and rules. But finance still needs to review any new or changed mapping. There should also be an audit log that shows who approved each change and when. That approval trail is required for U.S. GAAP compliance and audit readiness.[4]
Phoenix Strategy Group treats CoA standardization as the first step before automation, helping finance teams define one reporting structure before AI tools are configured.
With the data layer and CoA lined up, you can move into forecast models and automated FP&A workflows.
Once your data is clean and your chart of accounts is mapped, the next move is simple: put that setup to work inside your planning models and monthly finance routines.
A driver-based model connects what’s happening in the business to what shows up in the financials. Using the reporting structure from Step 2, you can forecast revenue from inputs like new logos, churn, ARPU, and upsell conversion, then roll those drivers into the P&L and cash flow.
Start with 15–25 core drivers across revenue, gross margin, headcount/opex, and working capital. Each one should tie back to a cleaned data source from Steps 1 and 2. [5]
A smart guardrail here: keep AI output in its own "AI forecast" column next to the management case, and log every override. That way, finance teams can see what the model suggested and where judgment changed the plan. ML models - time-series methods like Prophet for recurring revenue patterns, or multivariate regression for more complex driver relationships - can suggest forecast ranges based on historical data instead of relying only on manual assumptions. [8][6]
Here’s what that looks like in practice: if the AI points to a lower growth range, but the CFO moves the number up because of a large pending enterprise deal, that override should be saved with a note. No mystery. No black box.
| Dimension | Spreadsheet model | AI-assisted model |
|---|---|---|
| Data refresh | Manual, periodic | Automated, continuous |
| Forecast accuracy | Dependent on analyst assumptions | Trained on historical patterns and external signals |
| Scenario generation | One scenario at a time | Multiple probabilistic ranges simultaneously |
| Large dataset handling | Breaks down at scale | Handles multi-entity, multi-product data |
| Auditability | Formula-level, fragile | Logged, version-controlled, traceable |
| Key-person dependency | High | Lower with proper governance |
Rolling forecasts backed by AI usually run on 12–18 month moving windows, with updates each month as new actuals come in. [10][7] That shifts planning away from a static annual budget and toward a living model that tracks what the business is doing right now.
Once the forecast is built around drivers, the same data can support the recurring work that happens during close.
With the model in place, the next step is to automate the monthly close loop: refresh data, flag anomalies, draft variance commentary, update the forecast, and prefill board reports.
In practice, that means nightly data refreshes from the GL, AR/AP sub-ledgers, CRM, HRIS, and billing systems into one unified data warehouse. From there, variance detection can flag unusual deviations and surface them for analyst review. Natural language generation tools can draft the first pass of variance commentary. Roll-forwards can update from the latest actuals and revised driver assumptions. Board reporting templates can fill in updated charts and draft narratives automatically. [9]
Even one piece of this can save time. Automating variance analysis alone can remove 2–4 analyst hours per close cycle. [9]
| Dimension | Checklist-based workflow | Automated workflow |
|---|---|---|
| Data refresh | Manual pull, scheduled by analyst | Automated nightly sync with anomaly alerts |
| Variance detection | Analyst reviews line by line | ML flags outliers, prioritizes by materiality |
| Commentary drafts | Written from scratch each cycle | AI generates first draft; finance reviews and edits |
| Roll-forwards | Manual update of assumptions | Auto-updated from actuals and driver changes |
| Board reporting prep | Built manually from multiple sources | Pre-populated templates with draft narratives |
| Midmonth reforecast | Rarely done due to effort | Feasible with automated data and model refresh |
That said, automation doesn’t mean finance steps away. People still need to own every meaningful decision point. Advisory support from fractional CFO services can help define those stage owners and approval checkpoints so the process moves faster without losing accountability. Every automated step still needs approval gates and audit logs, which the next section covers.
Once AI starts producing outputs, controls determine what finance can trust, share, and publish.
After workflow automation, the next layer is control.
Higher-impact outputs need tighter approval. Routine forecast updates that stay within a small variance band can go to one finance manager for sign-off. But any change to revenue guidance, runway, headcount, or covenants should need CFO or founder approval before it moves anywhere.
Segregation of duties matters just as much as approval thresholds. The person setting up AI models or writing prompts shouldn't be the same person approving board-facing outputs. Role-based access should follow that same rule: users should only see the accounts, departments, and entities tied to their role. External reviewers should get read-only access, with sensitive fields redacted. [11][12]
Every AI-assisted output should include a non-editable, searchable audit trail that shows the source data, model version, parameters, timestamp, reviewer, and approver.
Here are the four risks most worth controlling for:
| Risk | What it looks like | Practical mitigation |
|---|---|---|
| Data leakage | Sensitive payroll or fundraising data exposed to external AI tools | Limit access, mask sensitive fields, keep AI inside approved environments |
| Model drift | AI forecasts diverge from actuals over time without anyone noticing | Set recalibration intervals; compare AI output against actuals each cycle |
| Biased outputs | A combined metric hides performance gaps across segments or cohorts | Validate outputs across product lines, customer cohorts, and regions |
| Over-automation | Material decisions - hiring, pricing, cash planning - made without human review | Require human sign-off for any output that affects guidance or external reporting |
One data point stands out: a Drivetrain survey of 258 FP&A professionals found that only 28% of finance teams have formal responsible-AI guidelines, and 26% have no guidance at all. [13] That's exactly why governance needs to be spelled out before AI outputs are used outside the team.
Once approvals are set, the next move is to lock the metric definitions your dashboards will use.
Controls fall apart if reporting uses different definitions from one report to the next. One metric needs one formula across board, lender, and internal reporting.
Lock definitions before you build dashboards. Gross margin, burn rate, runway, DSO, DPO, and revenue growth should all use fixed formulas. [11][15]
Use real-time dashboards for cash, collections, and pipeline. Use monthly packs for closed-period reporting. Closed-month actuals must stay fixed. [14][15]
| Dimension | Static monthly reporting pack | AI-enabled real-time dashboard |
|---|---|---|
| Update frequency | Monthly, after close | Continuous |
| Best use | Board, lender, and investor communication | Day-to-day management decisions |
| Metric stability | Fixed, period-over-period | Live, subject to intra-period changes |
| Narrative context | Included with variance commentary | Requires separate review layer |
| Anomaly detection | Analyst-driven, after the fact | Automated flags surfaced in real time |
| Governance requirement | Standard finance review | Stronger controls on metric definitions and access |
This isn't about picking speed or control. Finance needs both. Real-time dashboards surface issues faster, while monthly packs give external stakeholders the stable record they expect. With the right KPI definitions and a clear governance layer, AI can support both without creating two versions of the truth.
Once approvals, controls, and dashboard rules are set, rollout turns into a managed test instead of a leap of faith. A phased approach helps protect the close schedule while still giving you enough speed to show progress. Start with one workflow, prove it in shadow mode, and then expand.
Run AI in shadow mode first - read-only, next to the current process - for one or two full close cycles. That gives your team time to compare AI output with human work, spot data quality problems early, and build confidence before anything affects official reporting.
The table below outlines a 90-day rollout for a growth-stage U.S. company:
| Phase | Weeks | Owner | Key Milestone | Success Metric |
|---|---|---|---|---|
| Pilot | 1–4 | FP&A Manager | One business unit's revenue forecast live in shadow mode; ERP and CRM data integrated | Baseline error set; analysts trained; month-end close unaffected |
| Expand | 5–8 | Controller | Approvals and audit trails active; OPEX forecasting automated for 2–3 departments | 30% reduction in manual spreadsheet consolidation time [16] |
| Scale | 9–12 | CFO | AI dashboards used in monthly exec meeting and board prep; scenario planning live for cash runway | Forecast error down 20% [16]; positive board feedback; full FP&A adoption |
Use the pilot to prove the process before you roll training and adoption out across the team.
Training should match each role's day-to-day work:
Timing matters more than most teams expect. Don't launch new AI workflows during year-end close, audit weeks, or lender reporting deadlines. Run AI in parallel for one or two close cycles before switching over.
Each step in this guide builds on the one before it. Clean data makes account mapping more dependable. Consistent account mapping makes driver-based models more accurate. Accurate models make workflow automation easier to trust. Automation you trust makes approvals and controls matter. Strong controls make dashboards easier to rely on. And a phased rollout helps all of it stick without breaking what already works.
These seven steps amount to a finance transformation, not just a tech project. AI-powered forecasting can cut forecasting cycle time from about 18–25 days to 5–8 days [17], and top-performing FP&A teams using AI/ML achieve forecast variance within 5% of actuals compared to 12–15% for median peers [1]. That's the gap between reacting to last month's numbers and making decisions based on what's happening now.
If you want a faster close, cleaner forecasts, and reporting your board can use, Phoenix Strategy Group works with growth-stage companies on data engineering, model design, control frameworks, and rollout planning tied to your board calendar, funding timeline, and eventual exit.
Your FP&A data is ready for AI when each metric comes from one trusted source of truth and the data is accurate, complete, and consistent.
You also need standardized formats, clear data dictionaries, and automated daily or real-time reconciliation. That way, the numbers stay in sync instead of drifting apart behind the scenes.
Before integration, test a sample of your data that reflects what the AI will actually use. Check for:
Strong data governance matters too. Role-based access controls and documented data lineage help keep AI-driven insights reliable, so people can see where the data came from and who can use it.
Start with routine, time-consuming tasks that eat into strategic analysis. First, connect core financial data from your ERP, CRM, and banking platforms so you have a real-time, accurate base to work from.
Then automate repetitive work that has a big payoff, like account reconciliation, data mapping, and anomaly detection. As your team gets more comfortable, extend that work to reporting summaries, variance analysis, and predictive forecasting.
Use a human-in-the-loop approach so AI supports human judgment instead of taking over. Set clear governance limits, require human review for high-stakes finance decisions, and roll things out in phases. A smart place to start is read-only access, which lets your team check accuracy before AI touches anything sensitive.
Keep control with documented data lineage, immutable audit logs, and manual review of AI-flagged anomalies, formulas, and approvals. That way, outputs stay tied to your actual business reality, not just what the system assumes.