Published on
August 5, 2026


If I’m a CFO, I don’t need an AV risk model that looks polished. I need one that shows cash burn, runway, reserves, and funding timing when things go wrong.
This article boils AV risk down to a few finance questions:
The piece focuses on six risk buckets: recalls and safety events, insurance and liability, regulatory cost, development delays, supply-chain/BOM overruns, and cyber events. It also makes one point clear: AV loss history is still thin, so I should use base, extended, and worst-case scenarios instead of relying on standard averages.
A few numbers stand out. AV startups spend about $1.6 million per month on average, and industry timelines have slipped by 1 to 2 years versus earlier forecasts. That means even a short delay can shift cash needs by millions of dollars and move financing dates much closer.
What I like here is the framing. The article doesn’t treat risk as a legal or engineering side note. It treats risk as a direct input to:
Here’s the short version: I should model each risk in dollars, probability, and timing, then connect it to FP&A, cash forecasting, and board decisions. That is the core idea running through the full article.
AV recall models need to turn systemic failures into three things: affected units, cash timing, and net reserve needs.
Start with the event size that creates the biggest cash shock.
Build three scenario tiers tied to clear failure triggers:
For each scenario, define the affected units and the main cost drivers. That split matters. A contained event is one thing. A systemic event that spreads across markets is a very different problem.
Next, break gross recall cost into one-time cash charges and ongoing margin loss.
| Cost Line Item | One-Time Cash Charge | Ongoing Margin Effect |
|---|---|---|
| Diagnostics, investigation, and evidence preservation | ✓ | |
| Repair or replacement of sensors, cameras, and processing architecture | ✓ | |
| Shipping and reverse logistics | ✓ | |
| Defense fees, expert witness costs, and settlement of product liability claims | ✓ | |
| Regulatory fines and compliance costs | ✓ | |
| Lost sales from paused deployments | ✓ | |
| Valuation pressure from autonomous capability removal or failure | ✓ |
Legal reserves should be sized to the highest plausible claim path. Venue and timing can swing cash outflows hard, so this part can't be hand-waved.
Then reduce gross cost by coverage, deductibles, and retained losses.
Use a comparison table to track the scenario, trigger, affected units, main cost drivers, and the insurance and reserve assumptions that need testing:
| Scenario | Trigger | Affected Units | Primary Cost Drivers | Insurance / Reserve Assumption |
|---|---|---|---|---|
| Limited Batch | Sensor calibration error or specific hardware defect | Local fleet / specific production run | Repair/replacement, service labor, reverse logistics | Lower reserve tied to a contained event |
| U.S.-Wide | Software bug or battery safety issue | All vehicles in one U.S. jurisdiction | Regulatory fines, mass logistics, lost sales, brand damage | Higher reserve for single-jurisdiction exposure |
| Multi-Territory/Catastrophic | Cyberattack on V2X ecosystem or GPS/cellular failure | Global fleet / interconnected infrastructure | Legal fees, mass-catastrophe claims, deployment pause, valuation pressure | Stress test for the largest tail-risk event |
Use actual unit economics and policy terms to turn gross recall cost into net cash exposure.
Once you've sized your recall exposure, the next layer is the recurring cost of insurance and compliance. This isn't about a one-time recall fix. It's about the steady cash drain that puts pressure on margin, runway, and capital needs.
Start with premiums. Then map out when the cash leaves the business, because the timing matters just as much as the total.
AV insurance is tied to technical failure, not driver behavior. It usually includes product liability, E&O, and cyber risk. Because long-term loss history is still thin, years 1–10 need wide loss ranges.
That means your premium model should account for:
Premiums shape the annual cost base. Retained losses shape the liquidity hit. That distinction is easy to miss, and it can throw off the model fast.
Cash timing and accounting timing don't line up neatly. Premiums are front-loaded. Deductibles hit when claims open. Settlements may take years.
Multi-party AV claims can drag on for a long time, so reserve timing matters just as much as reserve size. A model that only tracks total exposure can look fine on paper and still run into a cash crunch.
Map each outflow to its payment date, reserve date, and settlement date. This is where covenant pressure and minimum cash thresholds start to bite.
After insurance, add the fixed cost of operating in each jurisdiction. Compliance is recurring OpEx, and AV models often understate it.
Model state fines, reporting, audits, and rule changes as fixed compliance OpEx in every place where the fleet operates. If you're active across several states, these costs don't just sit in the background. They stack up and weigh on margin.
The table below shows how each insurance and compliance item should flow into the financial model:
| Risk Component | Impact on CFO Model | Primary Driver |
|---|---|---|
| Annual Premiums | Operating Expense (OpEx) | Fleet size, deployment state, safety record |
| Retained Losses | Cash Flow / Reserves | Self-insured retention (SIR) levels and claim frequency |
| Claims Volatility | Risk-Adjusted Capital | Deviation from expected safety performance benchmarks |
| Compliance Overhead | OpEx / Margin | State-level reporting and federal audits |
| Cyber / AI Exposure | Contingent Liability | System interoperability and hijacking risks |
These fixed costs should feed straight into margin and runway.
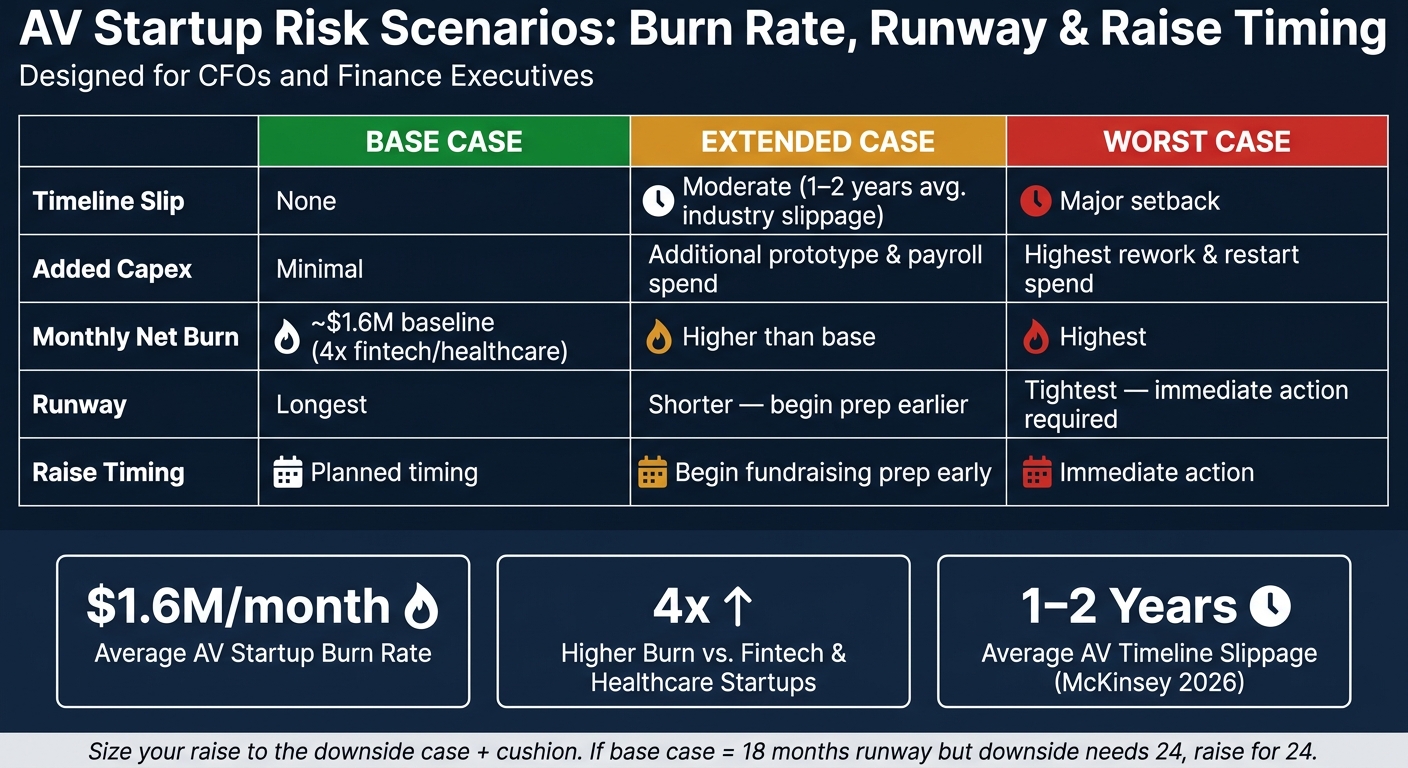
AV Startup Risk Scenarios: Burn Rate, Runway & Raise Timing
After insurance and compliance, the fastest threats to runway are delays and hardware overruns. One supplier miss or one failed validation cycle can push a launch back by months and force you to fundraise sooner than planned.
Use three cases: base, extended, and worst-case. Tie them to the current schedule, likely slippage, and bigger setbacks like failed validation, supplier disruption, or city-approval delays.
McKinsey's 2026 AV survey found that adoption timelines had already slipped by 1 to 2 years on average compared with 2023 forecasts.[2] So the base case should be conservative, not wishful.
Map the dates for prototype, testing, approval, pilot launch, and commercial ramp. For each stage, assign a probability of delay and a delay range in months. Then track the cash effect of each slip: extra payroll, more prototype builds, test-fleet operations, and revenue that arrives later than planned.
Once the schedule risk is on paper, pressure-test the hardware costs that often make those delays worse.
Track costs across sensors, compute, battery, wiring harness, power electronics, and contract manufacturing. Minimum order quantities can turn what looks like a small unit-price change into a big cash problem.
Aurora's 2022 supplier delay shows how launch slips and hardware cost targets can move in opposite directions.[4]
Build separate sensitivity ranges for each cost line. Include expedited freight premiums, scrap and rework rates, and second-source qualification costs. Then show how higher unit costs change total cash needs over time.
That gives you a straight line from hardware shocks to monthly burn and raise timing.
AV startups spend roughly $1.6 million per month on average - about four times the burn rate of fintech or healthcare startups.[1][3] At that level, delays get expensive fast.
Split burn into two buckets:
Every month of delay stacks more cost onto the delay-sensitive bucket.
Use one table to show slip, spend, runway, and raise timing:
| Scenario | Timeline Slip | Added Capex | Monthly Net Burn | Runway | Raise Timing |
|---|---|---|---|---|---|
| Base Case | None | Minimal | Baseline | Longest | Planned timing |
| Extended Case | Moderate | Additional prototype and payroll spend | Higher than base | Shorter | Begin prep earlier |
| Worst Case | Major setback | Highest rework and restart spend | Highest | Tightest | Immediate action |
Set the trigger before runway hits the board minimum. Investors will want to review safety performance data, supply chain resilience, and commercialization readiness before they commit. A company with healthy runway and a believable milestone plan has leverage. One with only a few months of cash left doesn't.
These runway cases feed straight into fundraising ranges, valuation, and M&A timing.
Use those runway cases to set raise size, valuation range, and deal terms.
Your model should show capital needs, runway, and valuation sensitivity for each scenario. Then tie every delay case to valuation sensitivity in both DCF and multiples. From there, lay out three raise sizes:
In practice, size the raise to the downside case plus a cushion. If the base case gives you 18 months of runway but the downside case needs 24, raise for 24. Raising too little can hurt your pricing power and increase the odds of a down round.
The main output here is a valuation range tied to clear risk outcomes, along with the minimum cash buffer needed to make it through the downside case. Investors doing diligence on AV companies will zero in on safety testing protocols, incident logs, certification status, and reserve methodology [5][6]. Your model should spell out how it was built, which scenarios it includes, and which assumptions move the numbers the most. That's the stuff investors will ask about first.
Use that same downside case when you move into M&A diligence.
Use the downside case to shape escrows, indemnities, and earn-outs in M&A deals. In structured deals, buyers with escrows, indemnities, and earn-outs usually won't pay full price without some protection. A quantified downside case gives you something concrete to negotiate from instead of just taking a lower fixed price.
Say your model shows a potential $15 million exposure tied to legal, recall, and delay costs. That number can feed straight into escrow sizing or a contingent consideration structure [7]. On the sell side, the model helps you see where buyers are likely to push back, so you can prep answers before the conversation gets tense. On the buy side, it brings integration costs and contingent liabilities into view, including items that may not show up in a standard financial review.
Use the same model to prep diligence responses, escrow asks, and earn-out terms.
The model only matters if it stays current. Use this checklist to keep it ready for decisions:
Use a driver-based approach with granular, well-documented assumptions instead of leaning only on past data. Start baseline projections with industry benchmarks and market research. Then run sensitivity analysis to see which cost drivers have the biggest effect.
It helps to pressure-test plausible downside cases too. For example, model what happens if there are recall delays or gaps in insurance coverage. As actual performance data comes in, update the assumptions and tighten the model.
Aim for 12 to 18 months of runway under your pessimistic case. In plain English, that means asking: if things go sideways, how long can the business keep going before cash runs out?
Stress-test your model against believable problems, such as:
The goal is simple: make sure the company can keep operating even when the road gets rough.
It also helps to set clear trigger points ahead of time. For example, if revenue drops by a set percentage, you already know it's time to act. That gives you room to make measured moves, like a hiring freeze or cuts to discretionary spending, instead of scrambling for last-minute financing.
Delay risk should trigger a fundraising plan when your cash runway drops below a set threshold, often 6 to 18 months based on your risk appetite.
If scenario modeling shows product development or market-entry delays could cut into the cash you need, start fundraising early. That keeps the move proactive and gives you a better shot at reaching the next value-creating milestone.