Published on
August 3, 2026

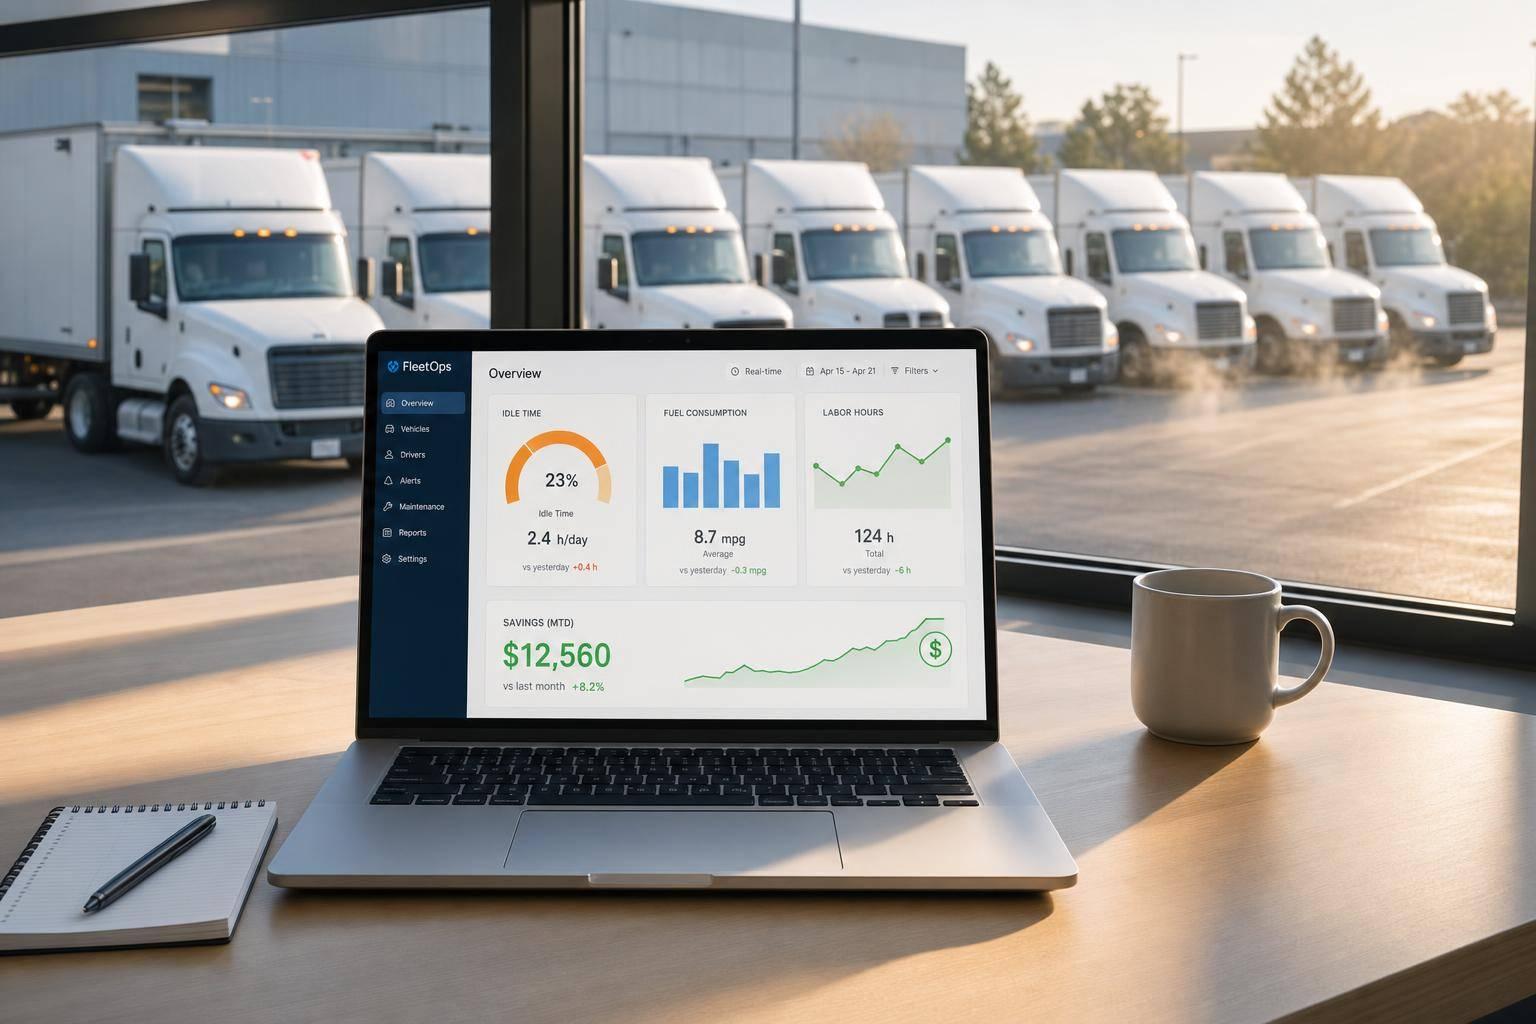
Idle time drains margin fast: about 1 idle hour can burn 1 gallon of fuel, and many fleet vehicles sit 1 to 2 hours a day. At $4.00 per gallon, that can turn into thousands of dollars per vehicle each year before you even count paid driver time, maintenance, insurance, and depreciation.
If I had to sum up the article in plain English, it’s this: fleet dashboards help you spot which idling is part of the job and which idling is just waste. Once I can see idle time by vehicle, driver, route, and shift, I can coach drivers, fix dispatch timing, change site rules, and check for truck issues.
Here’s the short version:
A dashboard does not cut cost by itself. It shows where the money is leaking, so you can act on the biggest problems first and confirm the savings in fuel, labor, and fleet spend.

Fleet Idle Cost: Low-Idle vs High-Idle Vehicle - Annual Cost Breakdown
Idle time hits your bottom line in a very plain way. Fuel gets burned. Wages keep ticking. Vehicles keep aging. And during all of that, you’re not getting a single productive mile or completed stop.
A typical fleet vehicle burns about 1 gallon of fuel per idle hour [1]. At $4 per gallon, that means $4 disappears every hour the engine stays on without moving freight. Stretch that across 250 operating days, and the gap gets expensive fast.
Here’s what that looks like over a year for a low-idle vehicle versus a high-idle vehicle:
| Metric (Annual - 250 Days) | Low-Idle Vehicle (0.5 hrs/day) | High-Idle Vehicle (2.5 hrs/day) | Difference |
|---|---|---|---|
| Total Idle Hours | 125 hours | 625 hours | 500 non-productive hours |
| Gallons Burned | 125 gallons | 625 gallons | 500 gallons wasted |
| Estimated Fuel Cost (at $4/gal) | $500 | $2,500 | $2,000 direct loss |
That’s not a rounding error. It’s money leaving the business for no output at all.
The picture gets much clearer when teams break idle time out by vehicle, route, driver, and shift. Once you can see where idle hours pile up, the cost stops hiding in the background.
Fuel is only one part of the problem. If a driver idles for 2 hours in an 8-hour shift, then 25% of paid shift time produces no output [2]. The driver is still on the clock, but the shift adds no miles, no stops, and no revenue during that time.
This puts pressure on two finance metrics: revenue per labor hour and cost per stop. Idle time pushes costs up without adding output, so both numbers move the wrong way shift after shift.
And it doesn’t stop with labor. Idle vehicles still rack up fixed costs like insurance, depreciation, and interest. Fleets without real-time visibility use vehicles less well [3]. That strain shows up in revenue per labor hour, cost per stop, and asset utilization.
The next step is figuring out where that idle time is happening. That’s where real-time dashboards make a big difference, turning idle time from a hidden cost into something teams can track.
Real-time dashboards turn idle time into cost data by vehicle, route, driver, and shift. They pull in telematics and GPS data, then translate it into idle cost metrics like idle hours, idle events, estimated fuel burn, and estimated cost.
That’s the part that matters. Raw data alone doesn’t help much. What helps is seeing where the waste keeps showing up.
| Dashboard View | Key Metrics Shown | Business Decisions Supported |
|---|---|---|
| Vehicle View | Engine-on vs. moving time, fuel burn rate | Identify assets with chronic idle patterns; flag for investigation or relocation |
| Driver View | Idle events, behavior scorecards | Targeted coaching for high-waste drivers; fuel efficiency incentive programs |
| Route View | Trip dwell time, traffic delay windows, route deviation alerts | Adjust scheduling around congestion; optimize stops to cut idle dwell |
| Shift & Site View | Idle asset count per depot, idle hours by site | Rebalance fleet resources between locations; eliminate unnecessary equipment rentals |
Each dashboard view reveals a different kind of idle waste. A vehicle view may point to one truck that burns fuel while barely moving. A driver view may show one person idling more than peers. A route view may show that the issue has less to do with people and more to do with traffic, stop timing, or dwell. Shift and site views add one more layer by showing when and where waste builds up.
Vehicle views compare engine-on time with moving time. If a vehicle shows high engine-on time but low mileage, that’s a clear warning sign. In plain terms, the engine is running, fuel is being burned, and the asset isn’t doing much work.
That can point to a few things:
One reading might be a fluke. Repeated readings usually mean there’s a pattern worth checking.
Driver scorecards help sort that out. They surface idle events so teams can see whether high idle time ties back to one driver’s habits or to the route that person is assigned. If the same issue shows up across several drivers, the route or shift is often the real source of the waste.
Route views show where dwell time jumps. Alerts can flag stops that go past target dwell time, which gives dispatchers a chance to step in before the delay snowballs.
There’s a simple way to think about it: route patterns show where delays happen, while shift patterns show when they happen.
Shift and site views compare idle behavior across depots and time windows. That makes it easier to spot situations where vehicles sit idle at one location while another site is still renting equipment. Once teams can see idle waste by vehicle, route, driver, and shift, they can go after the biggest cost drivers first.
Once dashboards show where idle time is piling up, start with the places that cost the most: the vehicles, drivers, routes, and shifts with the biggest drain. From there, you can sort out what kind of fix makes sense. Sometimes it’s coaching. Sometimes it’s dispatch timing. Sometimes the truck needs attention.
A good first move is driver coaching, especially for the biggest idle outliers. Focus on drivers in the bottom 10% to 20% by idle time. That kind of targeted coaching can lead to a 10% to 15% lift in fuel efficiency within 60 days of program rollout. [2] Weekly scorecards that track idle events help keep those talks fact-based instead of making them feel personal.
When the data shows route or shift-based idle spikes, dispatch timing is often the issue. Starting backhaul searches 1 to 2 hours before delivery completion can cut deadhead time by a meaningful amount. [2]
Idle alerts matter too. If you set alerts for events over 5 to 10 minutes, dispatchers get a chance to step in while it’s still a one-off stop, not a habit. [2]
If the same issue keeps showing up across shifts or sites, that’s usually a sign the problem goes beyond individual behavior and needs a policy change.
Daily fixes deal with behavior. Policy and equipment changes deal with the conditions that let idling keep happening in the first place.
Anti-idling policies need to stay consistent across every depot. In decentralized fleets, it’s common for sites to drift apart. One depot follows idle-reduction rules. Another skips steps and no one says much. That same pattern can show up in maintenance. Centralized oversight can move preventive maintenance compliance from the 50% to 65% range up to 85% to 95%. [3]
On the equipment side, predictive maintenance makes sense when repeat idle patterns at the vehicle or site level point to mechanical issues. Moving from fixed service intervals to condition-based maintenance with sensor data can cut breakdowns by 45% and lower maintenance costs by 30%, with a typical payback period of 8 to 12 weeks. [4] And when breakdowns drop, fewer vehicles sit idle waiting on a repair crew.
The table below shows what before-and-after results can look like for a 100-truck fleet acting on dashboard data:
| Metric | Before Optimization | After Optimization |
|---|---|---|
| Daily Idle Hours per Vehicle | 1 to 2 hours [1] | Less than 30 minutes [1] |
| Monthly Idle Fuel Cost (100 trucks) | ~$18,000 to $24,000 [1] | ~$4,500 to $6,000 [1] |
Finance teams can then pressure-test those savings in margin reviews. The key is simple: confirm that lower idle hours show up in margin and cost-per-mile numbers.
Finance teams can use idle data to explain margin swings and guide fleet spend. Idle data gives finance a straight line from telematics to margin impact. That turns idle cost into a monthly finance metric, not just an operations metric.
Start with a fully loaded idle cost that includes fuel, maintenance share, and paid idle labor. Once you have that single number, idle waste becomes much harder to miss in any margin review.
Finance should review five metrics each month: idle fuel cost per vehicle, idle cost as a share of revenue, fuel variance tied to idling, idle cost by customer or route, and utilization trends across depots. Decentralized fleets often run 15% to 25% lower utilization, which can lead to avoidable asset purchases and rentals [3].
These metrics turn idle data into budget, labor, and capex decisions.
| Idle Metric | Finance Use Case | What It Drives |
|---|---|---|
| Idle Fuel Cost | Budget variance analysis | Separates avoidable margin drain from fuel price shifts |
| Paid Idle Hours | Labor productivity review | Increases cost per shift and cuts profit per delivery |
| Engine Hours (Idle) | Maintenance forecasting | Leads to higher repair costs, which can run 40% to 60% more [3] |
| Utilization Trends | Capital spending and fleet sizing | Helps stop over-fleeting and can save $8,000–$15,000 per idle vehicle annually [4] |
| Idle Cost by Customer | Pricing & profitability | Guides contract renewals and detention fee structures |
When the same pattern shows up across depots, you're not just looking at a driver problem. You're looking at a fleet-sizing problem. One depot may have equipment sitting still while another is paying for rentals. That gap is worth acting on. Moving assets first can be a smarter call than approving another purchase.
Phoenix Strategy Group helps growth-stage companies connect telematics data to FP&A models and real-time margin dashboards, so idle metrics feed into the decisions that matter most.
For finance, idle data matters when it changes forecasts, pricing, and fleet plans. Fleet dashboards make idle waste visible in real time by vehicle, driver, route, and shift. Focused operational changes like coaching, dispatch timing, policy enforcement, and condition-based maintenance can cut both fuel spend and paid idle hours.
When finance teams bring idle metrics into monthly reviews, those numbers sharpen pricing decisions and make fleet planning easier to defend. The process works when teams keep doing the same few things well: measure, review, act, and confirm that the savings show up in the numbers.
There’s no single rule for what counts as acceptable idle time. It depends on the job, the route, and the type of vehicle.
That said, industry data shows idling can turn into a costly and avoidable problem. In some fleets, up to 29% of vehicles idle when they don’t need to.
Why does that matter? Because idling burns fuel while the vehicle goes nowhere. It can also push labor costs up, especially when drivers spend too much time sitting between stops or waiting on-site.
That’s why most teams focus on cutting idle time as it happens, not after the fact. Dashboards make that easier by showing idle time by driver and route, letting managers set thresholds, and flagging exceptions fast to help protect margins.
Start with the KPIs that have the biggest effect on cost and efficiency. Set a baseline for fuel consumption, maintenance cost per mile, and on-time delivery.
Because idle time is a major cost driver, track it along with labor efficiency and equipment downtime. These core metrics help teams spot waste in real time and make faster, data-driven adjustments.
Finance can prove idle reduction savings, but it starts with a clean baseline before any operating changes happen. That baseline gives the team a fair point of comparison, so later results aren’t just guesswork.
From there, real-time dashboards track fuel use and idle time by vehicle, route, and driver. That makes it much easier to compare current performance against past results and spot where savings are actually coming from.
Those savings usually show up in two places:
In many cases, they also appear in stronger revenue per total mile.
Phoenix Strategy Group helps link operating data with financial data so teams can see the margin impact in plain terms.