Published on
September 12, 2026


If your IP records are messy, your deal price can drop fast. In M&A, buyers use IP to judge how long revenue may hold, what legal risk they may take on, and whether they need escrow, earn-outs, or tighter reps.
As a fractional CFO, I’d boil the process down to four steps:
A few points stand out:
Here’s the core idea: I’d treat IP valuation as both a pricing tool and a risk test. Clean records, clear revenue links, and a supportable model can help you defend value and avoid worse deal terms.
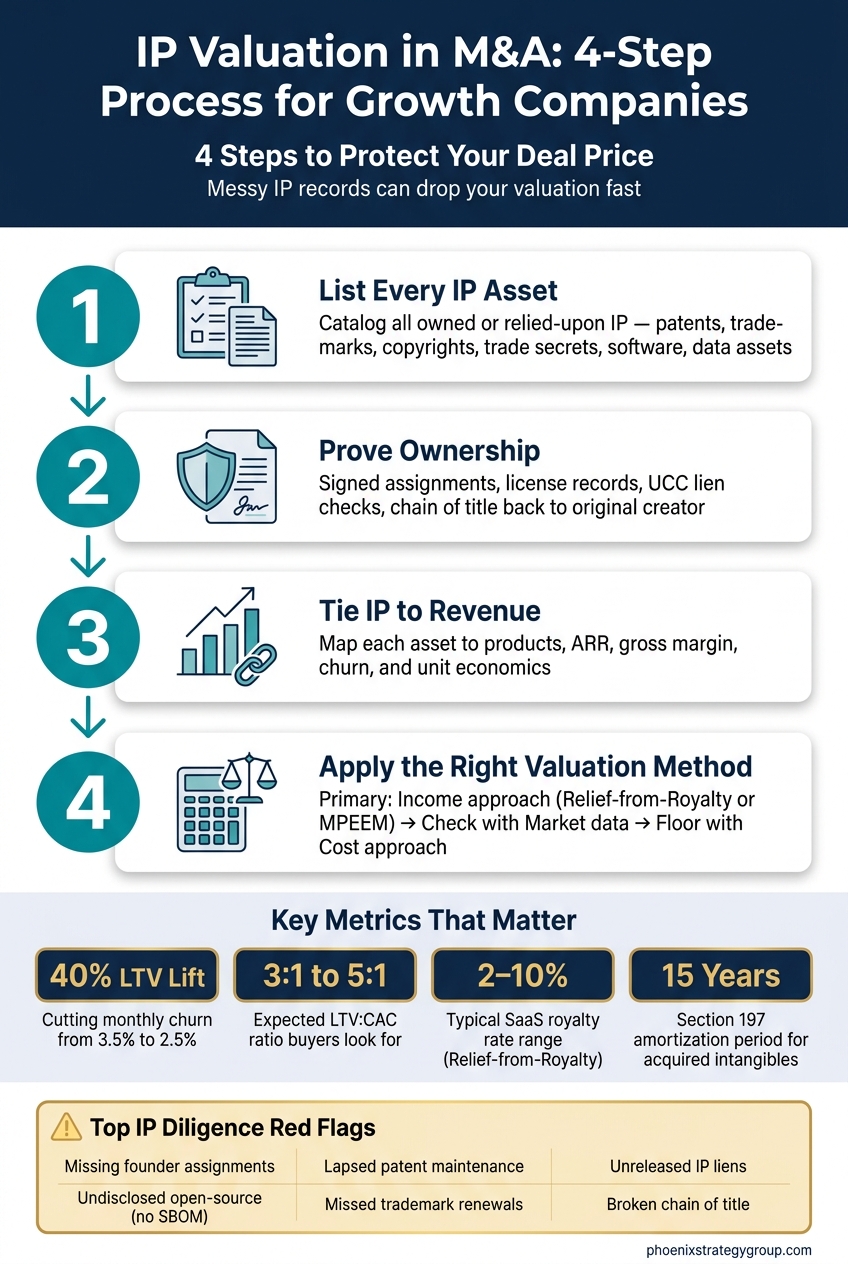
IP Valuation in M&A: 4-Step Process for Growth Companies
Before a valuation can stand up, buyers need clean proof that the company owns its IP and can transfer it. They usually look at every asset through three basic questions: Do we own it? Is it current? Is it pledged or restricted? If your records don't answer those fast, diligence drags out and deal terms usually get worse.
The goal is simple: build a file a buyer's legal team can review without sending request after request for missing documents. That work needs to happen before outreach.
Start with one central IP inventory that lists every material asset the company owns or depends on. That includes registered IP, source code, data, domains, and other material assets, including unregistered ones that drive competitive edge or recurring revenue. This isn't just an admin task. Clean records here can affect price. This is where fractional CFO services often provide value by auditing financial-IP ties before a sale.
For each asset, include the documents that show the company actually owns it. Founder IP assignment agreements are one of the most common weak spots. If core code or product designs were created before the legal entity existed, those rights need to be assigned to the company. The same issue applies to employees, contractors, and freelancers. Without clear assignment language, contractors may still hold ownership rights or a license to their work, and that's a common diligence red flag.[4][5]
Then trace the ownership chain back to the original creator. Make sure every transfer was documented and, when needed, recorded with the USPTO. Corporate name changes, past acquisitions, and co-founder departures are common places where the chain breaks.[4][5] It's also smart to check for UCC filings or security agreements that show IP was pledged as collateral to a lender. If those liens were never released, buyers will want release documents or payoff letters before closing.[6]
For U.S. patents, gather the application or patent numbers, filing and grant dates, maintenance history, and any open office actions. A patent that lapsed because someone missed a maintenance payment can cut deal value, and buyers will look for that.[5][10]
Trademark records need the same level of care. Track registration numbers, first commercial use dates, renewal deadlines, and territorial coverage. The USPTO requires a Section 8 declaration of use between the 5th and 6th years after registration, plus a Section 8 + 9 renewal between the 9th and 10th years and every 10 years after that. Miss those windows, or fail to respond to a post-registration office action, and the registration can be canceled.[10][11][12]
Registrations are only part of the picture. You also need a record of every inbound and outbound license, including scope, exclusivity, royalties, termination rights, and any change-of-control or anti-assignment clauses. For software-heavy companies, open-source use is now a standard diligence item. Buyers want a software bill of materials (SBOM) listing each open-source component, its license type, and proof of compliance. Copyleft licenses like GPL and AGPL can trigger source-disclosure duties that clash with a buyer's plan to sell the software as proprietary, so that issue needs to be flagged early.[7][8][9]
Keep a risk log too. It should cover any third-party claims, cease-and-desist letters, trademark oppositions, or threatened litigation. Buyers want to see that risks were tracked and handled in an organized way, not found halfway through diligence. If a problem can't be fully fixed before outreach, label it clearly: fix before closing, condition to closing, indemnity, or price reduction.[5]
| IP Category | Ownership Evidence | Registration Needs | Common Risks | Key Diligence Records |
|---|---|---|---|---|
| Patents | Inventor assignments, USPTO recordation | Application/patent numbers, maintenance fee history, office actions | Lapsed maintenance, missed office actions, inventorship errors | Assignment agreements, USPTO filing receipts, maintenance payment records |
| Trademarks | Company ownership records, first-use evidence | Section 8/9 filings, renewal deadlines, territorial coverage | Missed renewals, cancellation, unregistered marks in key markets | Registration certificates, specimens, renewal records, office action responses |
| Copyrights | Work-made-for-hire clauses, assignment agreements | Registration numbers for key works (software, content) | Unregistered works, missing author assignments | Copyright registrations, authorship/assignment docs, source files |
| Trade Secrets | NDAs, access controls, internal policies | No registration; protection depends on reasonable secrecy measures | Inadequate confidentiality controls, undocumented disclosure | NDA logs, access control policies, confidentiality agreements |
| Software / OSS | Employee/contractor IP assignments, repository logs | SBOM, license mapping, compliance records | Copyleft obligations, undisclosed components, restrictive licenses | SBOM, open-source policy, scanning tool reports, modification history |
| Data Assets | Data source contracts, privacy policies, vendor terms | Data rights documentation, consent records | Privacy law compliance gaps, restricted transfer rights | Dataset provenance records, data processing agreements, privacy compliance docs |
Once ownership, maintenance, and risk are documented, tie each asset to the revenue it protects.
Once ownership is in order, buyers move to the next question: does the IP drive revenue, margin, and retention? They want a clear, data-backed link between each material IP asset and the business results it supports. That link becomes the proof behind the valuation approach in the next section.
Start with an IP-to-product map. For each core asset - a software module, patent family, brand, or proprietary dataset - show which products rely on it, what share of revenue those products bring in, and how the IP affects pricing or win rates.
Don’t dump all product revenue onto one IP asset. Be precise. If a proprietary algorithm powers a recommendation engine, and that engine sits inside a premium SaaS plan, tie the asset to that plan. If the plan makes up 60% of ARR and sells at a higher price than the basic tier, document that link. The goal is specific, auditable attribution.
Pull ACV, renewal dates, and expansion revenue. Then tag each contract to the IP-backed product it supports. After that, connect those contracts to cash flow by tracking invoices and collections over time. If customers using a proprietary analytics feature show 96% gross retention versus a 90% baseline, that gap tells a story buyers can underwrite.[14][15][16]
After you map IP to products, test that same relationship in churn, margin, and payback data. Strong IP usually shows up in the numbers long before anyone starts a formal valuation. Lower churn, higher LTV, faster payback, stronger net retention, and better contribution margins all point to IP doing real economic work. The job here is to make those signals measurable and traceable.
Take churn as an example. Cutting monthly churn from 3.5% to 2.5% can lift customer lifetime value by roughly 40%, while extending average customer lifetime by more than 12 months.[15] If that drop is concentrated among customers using one IP-backed feature, you now have a direct line from the asset to better LTV.
The same logic works on margin. A proprietary automation layer that reduces support headcount per $1 million of ARR should show up as lower COGS and a higher gross margin. That’s proof the IP is cutting delivery cost, not just adding top-line revenue.
Buyers in growth-stage deals usually expect an LTV:CAC ratio of 3:1 to 5:1. In plain English, each customer should generate $3 to $5 in gross profit for every $1 spent to acquire them.[16][17][19] If IP-backed products hit that mark and other products don’t, the case for a higher valuation gets much easier to defend.
| IP Asset | Associated Product | Annual Revenue (USD) | Gross Margin Effect | Retention Impact | KPI Evidence |
|---|---|---|---|---|---|
| Patented Routing Algorithm | Premium Logistics SaaS | $3,200,000 | 72% vs. 65% portfolio average | 96% gross retention vs. 90% baseline | 40% faster implementation, lower support tickets |
| Proprietary Customer Behavior Dataset | Advanced Analytics Add-On | ARR by product from GL/CRM | Gross margin by product; supports higher pricing and lower discounting | Gross retention by cohort for dataset users | 20%–30% higher ASP; feature adoption; deal notes |
| Core Brand & Trademark | Enterprise SaaS (direct sales) | ARR by product from GL/CRM | Gross margin by product; higher ASP and lower discounting in competitive deals | Gross retention by cohort; stronger organic lead flow | Brand-driven leads; CAC trend by channel |
| Automation Software Module | SMB Self-Serve Plan | ARR by product from GL/CRM | 75% gross margin vs. 65% for manual or off-the-shelf delivery models | Gross retention by cohort; lower churn and faster payback period | Support cost trends; 12-month payback vs. 20 months for legacy offerings |
Build this table from GL- and CRM-reconciled data, and keep it current for diligence. Once those links are documented, the next step is choosing the valuation method that fits the deal.
Pick the method that matches the records you already have, the forecast support you can stand behind, and how clearly the IP ties to cash flow.
The income approach is often the best fit when the IP has a clear link to cash flow. That usually means software, patented technology, proprietary algorithms, or a trademark that helps drive repeat customer demand. Use it when you can support forecasts for growth, churn, pricing, and useful life.[30][32][33][37]
Start here when future cash flow is visible. In practice, two methods show up again and again.
Relief-from-royalty (RFR) estimates the royalty you avoid paying because you own the IP instead of licensing it. The process is pretty direct: forecast IP-linked sales, apply a market-based royalty rate, subtract taxes, and discount the after-tax savings back to present value.[13][29][31][32][34] For a SaaS company with a proprietary platform, software royalty benchmarks often land in the 2–10% of net sales range. That range can help anchor the royalty assumption.[23] RFR tends to work best for software, technology, and trademarks when licensing benchmarks exist and the revenue tied to the IP can be measured.
Multi-period excess earnings (MPEEM) is a better fit when one intangible asset is doing most of the heavy lifting for a product family or business line. It isolates the residual cash flow left after returns on contributory assets are taken out.[21][22][24][25][26][27][28][30][34] It asks for more detail, no question. But when the IP sits at the center of the deal thesis, that extra work can lead to a more precise answer.
If tax amortization benefit, or TAB, applies, include it. It can add material value.[21][29][34]
Market data helps test your assumptions. Cost data helps set a floor.
The market approach looks at observed license rates and comparable deals.[18][38][39][20][41][42] Use it to back-check income-based results and tune royalty rate assumptions. Don't lean on it as the only basis for value.
The cost approach looks at what it would take to create, reproduce, or replace the IP.[30][32][36][40] That's useful, but it has a clear limit: it doesn't reflect speed to market, competitive moat, or data network effects. So in most deals, it's best treated as a floor.
Both approaches matter in M&A because buyers will pressure-test the income model. Market evidence can support the assumptions. Cost data can keep the value from drifting too far from economic reality.
In most sophisticated M&A processes, the income approach drives the headline number, market evidence checks the key assumptions, and the cost approach provides a conservative lower bound. Used together, the three methods give both sides a more complete and defensible picture.[30][35]
| Method | Data Requirements | Best-Fit IP Types | Strengths | Limitations | Common M&A Use Case |
|---|---|---|---|---|---|
| Income – Relief-from-Royalty | Revenue forecast by product, royalty rate benchmarks, tax rate, discount rate | Software, technology, trademarks, brands | Directly tied to revenue; benchmarkable royalty rates available; widely accepted | Weak when no reliable royalty comparables exist; hard to isolate IP revenue in bundled products | Primary method for software and SaaS platforms; trademark valuation in brand-driven deals |
| Income – MPEEM | Detailed forecasts, contributory asset charges, tax assumptions, discount rate | Core patents, primary technology, key customer relationships | Captures full economic contribution of primary IP; nuanced and precise | Data-intensive; requires strong forecast support and clear asset separation | Core technology in strategic acquisitions; IP driving a single dominant product line |
| Market | Comparable license agreements, royalty databases, transaction benchmarks | Patents, brands, software with active licensing markets | Grounded in observed market behavior; adds external credibility | Comparables often scarce or non-public; limited for niche or proprietary assets | Corroborating income-based results; calibrating royalty rate assumptions |
| Cost | Development costs, engineering hours, R&D spend, replacement estimates | Early-stage tools, internal platforms, datasets with limited revenue history | Simple to calculate; useful when earnings are uncertain | Ignores strategic value, market position, and future earnings potential; typically a floor only | Conservative lower-bound check; early-stage IP with no monetization history |
The method you choose shapes the next round of buyer questions. It tells them which assumptions to test, which records to request, and where they'll push hardest.
Once the valuation model is in place, diligence is where the numbers meet the paperwork. This is the stage where a buyer checks the records and assumptions behind the model, line by line.
Start with a read-only VDR that’s easy to navigate. Organize it by ownership, registrations, licenses, code, open-source, disputes, and privacy. Give each folder one internal owner so nothing falls through the cracks.
Before diligence begins, flag the issues most likely to slow a deal or weaken value: missing assignments, unclear code ownership, risky open-source use, lapsed registrations, pre-incorporation development, third-party claims, and undocumented affiliate ownership.[47][48]
IP valuation outputs aren’t just for a buyer’s spreadsheet. They can shape the deal.
When ownership is clean and the link between IP and financial performance is clear, sellers are in a stronger spot to support a higher purchase price. It can also cut down the need for large escrows or broad indemnities. When there are gaps, buyers often push back with earn-outs, holdbacks, or asset-specific indemnities tied to the problem IP. The smart way to frame the discussion is around clean value versus risk-adjusted value.[2][3][46]
In U.S. deals, valuation also feeds into purchase price allocation. Under Section 197, buyers generally amortize many acquired intangibles, including goodwill and many acquired IP rights, over 15 years.[44] That tax rule can shape how a buyer spreads purchase price across tangible assets, goodwill, and identifiable intangibles. So it helps to line up valuation, accounting, and tax advice early instead of sorting it out under deadline pressure.
The same work also sharpens sale and fundraising messaging. If the evidence supports a sale case, it usually strengthens the investor story too, especially around defensibility and pricing power. It also shows where R&D dollars should go before a raise or exit. Put more time into protecting and documenting the assets that drive results. Pull back on low-impact assets that don’t change the story much.[1][43][45]
Phoenix Strategy Group can help growth-stage companies connect IP, financial models, and M&A readiness when internal capacity is limited.
Use this as a final pre-process check:
For growth-stage companies, start preparing IP records years before a planned exit. That gives you enough runway to review what you own, spot gaps, and fix issues before a buyer starts digging through the details.
When you're in active deal prep, start IP cleanup 6 to 12 months before the expected closing. That window helps you verify ownership, confirm enforceability, and get your documents in order for a smoother process.
It depends on your goals and the data you have. Income-based methods like MPEEM or DCF are often a good fit for SaaS because they connect value to steady, recurring revenue, such as subscriptions and usage fees.
If one platform or a core code base drives most of the earnings, MPEEM can help isolate those cash flows. Market-based methods can also give you quick, transaction-based benchmarks.
The biggest problems usually come down to unclear ownership or a broken chain of title. In plain English, that means the rights trail doesn't cleanly show who owns what. This often happens when founder, employee, or contractor assignment agreements are missing, or when work-for-hire clauses were never signed.
Buyers also mark down portfolios tied to unresolved disputes, infringement litigation, validity challenges, or messy records. That can include lapsed patent fees, expired trademarks, or license terms that limit use in ways a buyer doesn't want. When those issues show up, the deal often shifts to risk discounts, escrow holdbacks, or fixes that need to happen before closing.