Published on
August 4, 2026


If a loyalty game changes customer behavior but fails the margin test, I would not call it a win. A CFO should look at gamified loyalty the same way they look at pricing, promos, or CAC: by asking whether incremental contribution profit beats total program cost.
Here’s the short version:
A gamified loyalty program is not just about engagement. It is a margin, cash flow, and reserve question first.
| Reward Type | Main Cost Pattern | Margin Effect | Cash Timing | Main Finance Watchout |
|---|---|---|---|---|
| Points | Liability builds as points are issued | Delayed | Later | Reserve accuracy |
| Coupons/Discounts | Per-order rebate | Immediate | Immediate | Gross margin pressure |
| Tier Perks | Varies by perk | Mixed | Mixed | Perk-by-perk cost creep |
| Physical Rewards | Item + fulfillment cost | Varies | Upfront or at fulfillment | Shipping, storage, stock risk |
If I were reviewing a launch plan, I’d want one thing above all: a model that shows reward cost, redemption timing, breakage, and payback before the first point goes live.
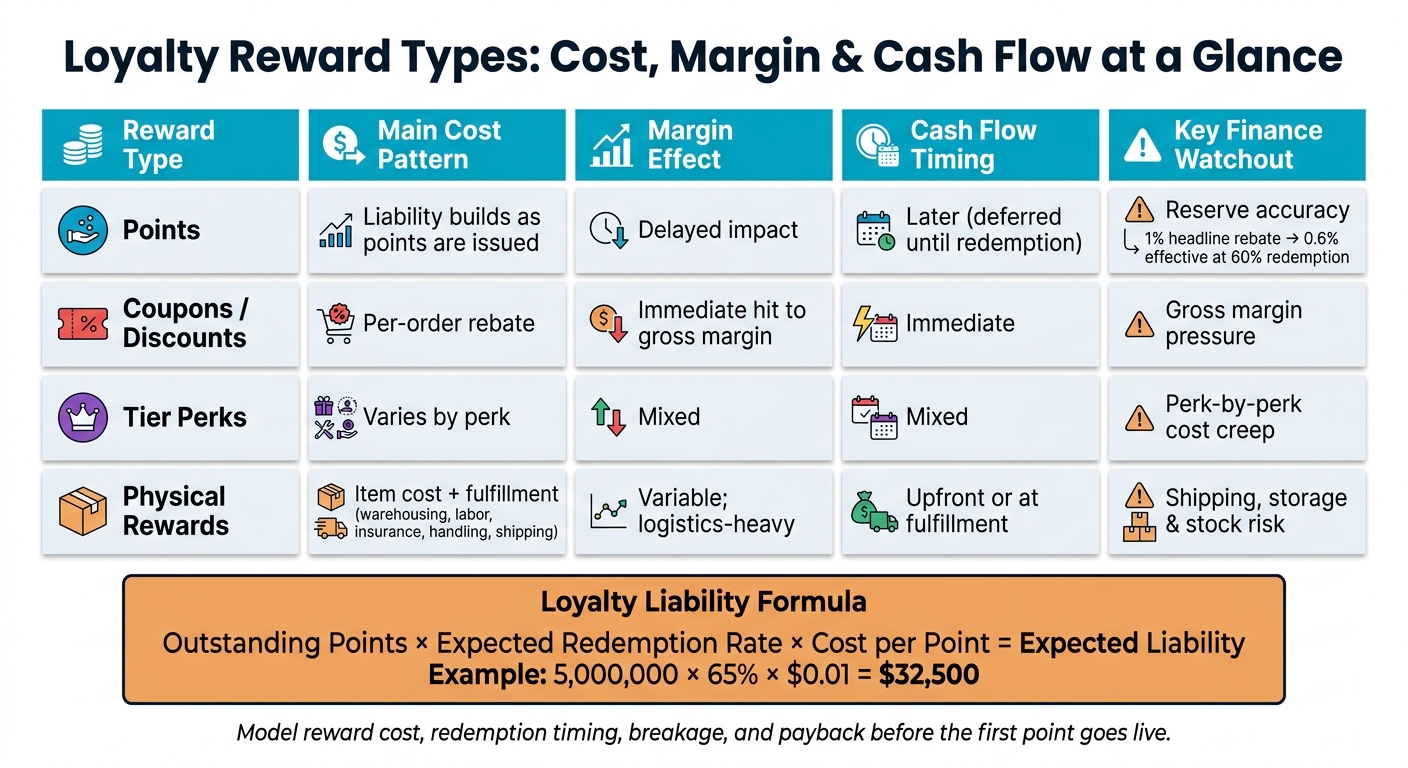
Loyalty Program Reward Types: Cost, Margin & Cash Flow Comparison
Use the same unit-economics lens you’d use for launch planning and put a dollar amount on each reward mechanic before you build it. That’s the only way to see if the program helps margin or eats into it.
Start with points. If your program gives 1 point for every $1 spent, and each point can be redeemed for $0.01, that’s a 1% rebate on every dollar spent. On $10 million in annual revenue, that equals $100,000 in reward value before you factor in delivery, platform fees, internal team time, and promo spend [2].
Your effective rebate rate is the headline reward value multiplied by expected redemption. So if 60% of points get redeemed, a 1% headline offer turns into a 0.6% effective rebate. That doesn’t make the liability disappear, though. You still need to model it based on active points and expected redemption behavior.
Tiers and perks need the same dollar-based treatment. Model each perk on its own and include delivery, platform, labor, and promo costs [2]. For physical perks, don’t stop at the item cost. Add warehousing, labor, insurance, handling, and shipping [1].
The formula is simple:
Outstanding Points × Expected Redemption Rate × Cost per Point = Expected Liability [1]
If you have 5 million points outstanding, expect 65% of them to be redeemed, and each point costs $0.01, your expected liability is $32,500. Set aside that amount before people start redeeming.
"Incorporating a points-for-rewards system guarantees you have adequate financial provisions for reward redemption. Typically, this involves reserving a fund that covers the cost of the market value of active points, adjusted for the redemption rate." - Paweł, Marketing and Loyalty Expert, Open Loyalty [1]
Track this by cohort instead of leaning on one blended average. Use issuance date, redemption speed, and expiration policy. That gives you a much cleaner forecast.
Not every reward structure hits the business the same way. Some costs show up later. Others hit margin right away.
| Reward Type | Typical Cost Structure | Margin Impact | Cash Flow Timing | Accounting Recognition |
|---|---|---|---|---|
| Points | Accrued liability | Deferred | Delayed | Deferred until redemption |
| Discounts / Coupons | Per-transaction rebate | Direct hit to gross margin | Immediate | Immediate |
| Physical Gifts | Upfront + fulfillment | Variable; logistics-heavy | Upfront or on fulfillment | On fulfillment |
Points give you more room to manage timing, but they also demand tight liability tracking. Discounts and coupons reduce margin as soon as they’re used. Physical gifts carry the full fulfillment bill, including warehousing, labor, insurance, handling, and shipping [1].
For each tier benefit, tie the reward to the cost driver behind it:
These inputs feed the redemption and breakage forecast in the next model.
Once you've modeled reward costs, the next job is forecasting how customers will behave in practice. That's where things get real. The gap between issued rewards and redeemed rewards is where your P&L timing and cash flow assumptions either hold up or start to crack. These forecasts feed the payback model in the next section.
Redemption rate is the share of issued rewards that customers actually use. Breakage is the share that expires unused. Those two numbers shape when reward cost shows up on your income statement and how much liability sits on the books.
A single blended redemption rate can blur what's actually happening. It's better to look at redemption curves and time-to-redemption by cohort. When you track by issuance month, customer segment, and reward type, you get cleaner reserve and cash-flow forecasts [2]. Tracking the time between reward issuance and use also matters because it shows the lag between issuing a reward and feeling the cash flow impact [2].
Low redemption doesn't always mean things are going well. Yes, unredeemed points can lower near-term payout costs. But if customers aren't redeeming because rewards feel too far away or not worth it, the program may be hurting engagement instead of driving it. Low redemption can also point to weak engagement and lower future purchase frequency.
Use that same cohort view when you compare mechanics. Game mechanics don't just make a program feel more fun. They change when customers redeem and how often they do it, which shifts the timing of reward expense.
Streaks and milestone bonuses tend to speed up redemption, so reward costs hit the P&L sooner. Your reserve assumptions should reflect that faster pattern instead of relying on a slower blended average [2].
Milestone rewards are especially useful during onboarding because they can reduce early-stage churn and improve long-term retention [2]. Multi-choice rewards often lead to higher redemption rates because customers like having control over what they get [2]. From a finance angle, mechanics that speed up redemption also speed up reward expense. So the reserve model needs to match that timing. A mechanic with slightly lower early conversion but much higher redemption and retention is usually the stronger long-term bet.
Some customers will build up points and never use them. That breakage has to be managed carefully if you want accurate liability reporting [1].
If you offer physical rewards, low redemption can leave you with extra inventory and storage cost. High redemption creates a different problem: you need tight logistics planning so items don't go out of stock and hurt customer trust [1]. The safest move is to base breakage assumptions on actual cohort behavior, then update them as redemption patterns shift.
Holdout tests help here too. A control group that gets no rewards can show whether the program is driving true incrementality or simply giving rewards to customers who would have purchased anyway [2]. Those updated breakage curves should then flow into the payback model.
Engagement metrics show participation, not profit. To see what a program is doing for the business, turn the redemption and breakage assumptions above into monthly cash flow. That’s the part a CFO will care about: incremental revenue, contribution margin, payback period, and unit economics.
A payback model answers one simple question: In which month do cumulative net cash inflows pass cumulative program costs? Start with the reserve, then map redemption timing into monthly cash outflows. Total program cost should include reward face value, delivery and platform fees, internal management time, and promo spend. Use cohort redemption curves to time reward cash outflows.
On the revenue side, count only incremental gains. That means the lift in purchase frequency, retention, and repeat purchase behavior that would not have happened without the program. Use holdout testing to isolate that lift. Loyalty program members generate 12% to 18% more incremental revenue growth per year than non-members [2]. It also helps to model the program across 12 to 36 months since reward effects build through repeat purchases.
Once you know when payback happens, you can pressure-test each mechanic at the customer level.
Each mechanic should be judged at the customer level, not just by top-line totals. The core question is simple: Does this mechanic improve contribution margin per active member after reward expense and cost-to-serve are taken out?
To answer that, you need a small set of inputs:
If a mechanic improves contribution margin after all-in costs, keep it. If not, cut it or rework it.
The same mechanic can look great on engagement and still miss on payback.
| Mechanic | Primary Cash-Flow Effect | Cost per Customer | Expected Revenue Lever | Payback Profile | Key Financial Consideration |
|---|---|---|---|---|---|
| Tiered Rewards | Long-term spend increase and retention | Moderate | Higher LTV from top-tier members; increased spend per visit | Long | Benefits can erase margin if overpromised. |
| Streaks/Missions | Repeat engagement and habit formation | Low | Frequency lift; reduced churn in early cohorts | Short–Medium | Direct cost stays low. |
| Points-for-Rewards | Continuous engagement and repeat purchase behavior | Moderate | Long-term accumulation and lock-in | Medium | Requires a redemption reserve. |
| Coupon-based Rewards | Immediate repeat purchase | Low | Direct gross margin impact | Short | Hits gross margin immediately. |
The point isn’t to choose the mechanic with the highest engagement score. It’s to choose the one where the math works inside your planning horizon.
After launch, monitor the program every month to protect margin and cash flow. Once you set redemption and breakage assumptions, governance is what keeps those numbers tied to what’s happening in the business.
The dashboard should make one thing clear: are your assumptions still holding up right now? At a minimum, track redemption rate, time-to-redemption, reward-led acquisition cost, 90-day retention, and incremental margin [2]. If redemption swings from one month to the next, flag it early before it starts warping reserves. Time-to-redemption also helps you forecast cash flow needs and spot possible redemption shocks [2].
You should also reconcile the reserve balance each month against active points and updated redemption assumptions [1]. That report should show whether gamification is still improving contribution margin, or if the lift has started to fade.
Ownership needs to stay clear:
Supplier terms need a monthly review too, especially pricing, delivery timing, and return policy risk [1].

When these metrics sit in different systems, they tend to drift apart. One team reports one number, finance sees another, and suddenly nobody trusts the dashboard. Phoenix Strategy Group helps growth-stage companies connect loyalty data to FP&A, cash flow forecasting, and KPI reporting.
Before any program scales, take a hard look at redemption rate, liability reserves, time-to-redemption, reward-led acquisition cost, and incremental margin. Scale only when the model shows positive margin and payback. If the model shows the program improves the business, keep it. If it doesn’t, redesign it - or don’t launch it.
Build a financial model that separates incremental revenue from total program costs. That sounds simple, but it matters a lot. If you lump everything together, it gets hard to tell whether the program is driving profit or just moving money around.
Model reward costs against gross margin, CAC, and LTV. In plain English: don’t just ask what rewards cost. Ask how those costs affect the economics of getting and keeping a customer.
Use this formula:
Net Profit = (Incremental Revenue × Gross Margin) – Total Program Costs
For Total Program Costs, include every major expense tied to the program:
You’ll also want to calculate cost per point, including breakage. That means looking at the expected cost of points that are issued versus the share that never gets redeemed. If 100 points are issued but only part of that balance is ever used, the actual cost per point can be lower than the face value. That gap matters.
To pressure-test the model, run it against historical account data. Look at past purchasing behavior, redemption patterns, margin by order, and repeat purchase rates. Then use a holdout group to measure true incremental lift. That’s the cleanest way to see what the program changed, instead of giving it credit for revenue that would have happened anyway.
A healthy redemption rate for a loyalty program usually falls between 20% and 30%. Some benchmarks use a broader range of 15% to 30%, but 20% to 30% is often seen as the sweet spot between customer engagement and financial liability.
It helps to track this metric alongside your earn-to-burn ratio. If the redemption rate is low, your rewards may not be appealing enough or may feel too hard to reach. If the rate drifts outside normal ranges, it can point to financial strain.
Direct cash-back and deep, broad discounts usually put the most pressure on margins. Why? Their cost hits right away, it’s easy to predict, and it grows as sales volume grows. On each transaction, they cut into profit directly.
Non-monetary rewards - like exclusive access, premium support, or status-based perks - tend to do less damage. They can still carry a cost, but they don’t always shrink profit in such a direct way. To protect margins, set clear limits on the discount-equivalent value.