Published on
August 25, 2026

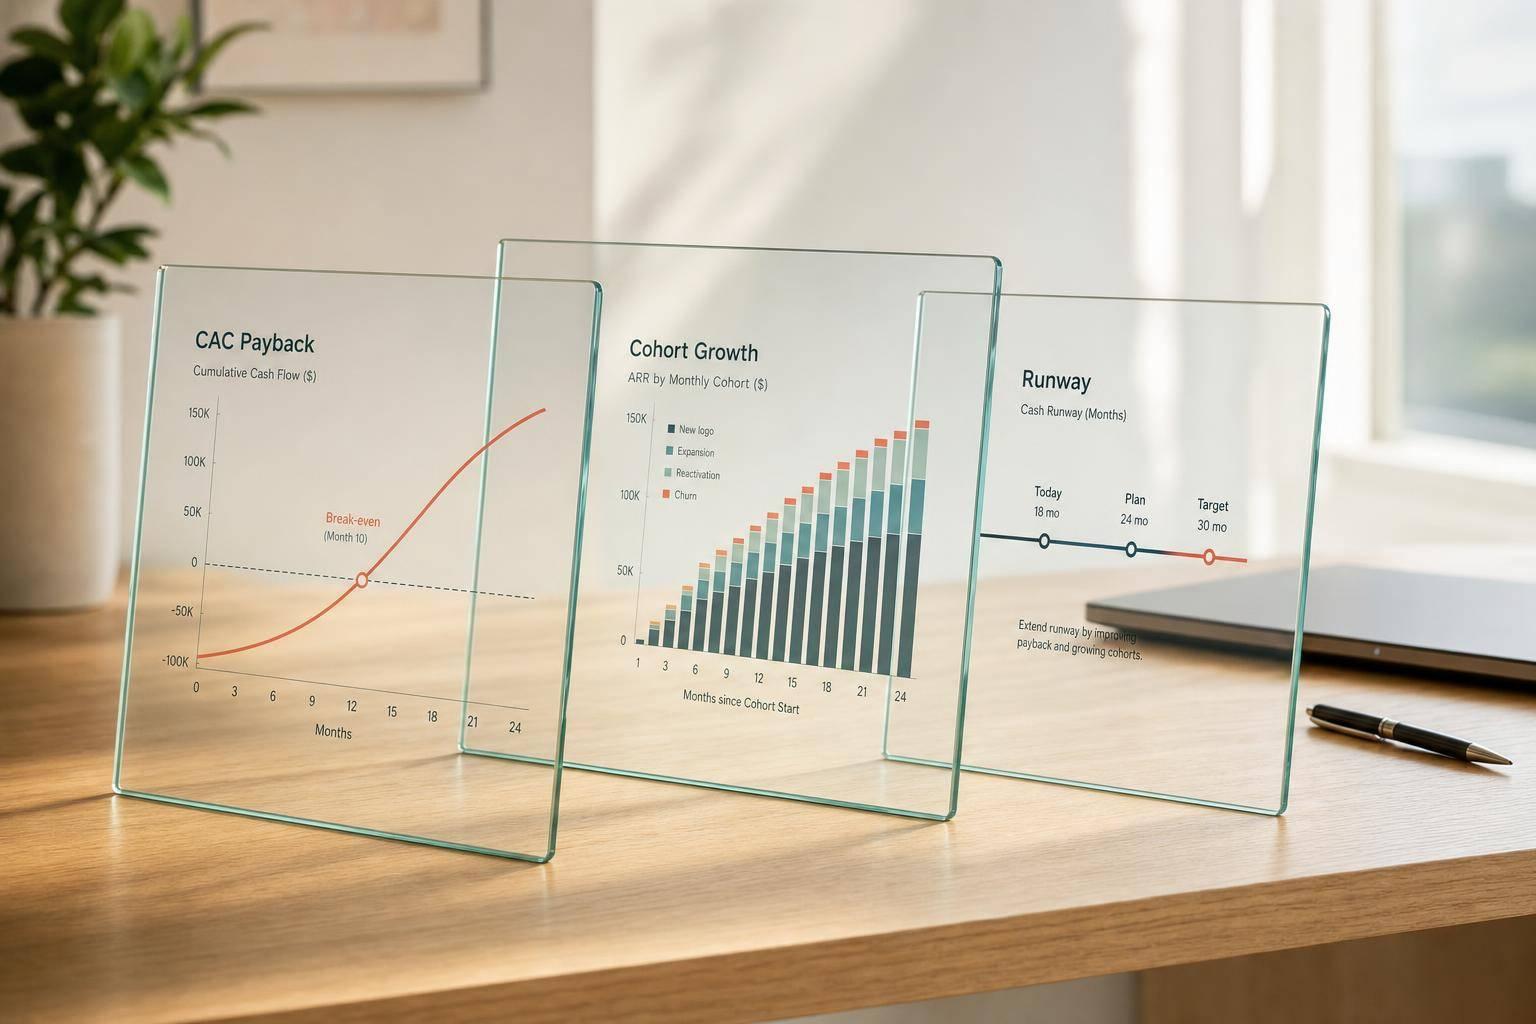
If your CAC payback is too long, growth gets more expensive fast. I’d use this one metric to decide when to hire, how much to spend on sales and marketing, and whether my runway can support the plan.
Here’s the short version:
A simple example makes it clear. If I spend $120,000 to win 40 customers, CAC is $3,000 per customer. If each customer adds $400 MRR at 80% gross margin, payback is about 9.4 months. That’s the kind of number I can use to judge if a hiring plan makes sense or if I’m pushing burn too far.
The main point: revenue growth alone doesn’t tell me if growth is affordable. CAC payback connects acquisition spend to cash recovery, which is why it should sit next to burn rate and growth on the same dashboard.
If you calculate CAC too narrowly, payback will look shorter than it is. Fully loaded CAC includes all direct customer-acquisition costs. That usually means sales costs like AE and SDR salaries, commissions, and bonuses; marketing costs like demand gen salaries, paid media, events, and agency retainers; plus tools and overhead such as CRM, sales engagement software, and trade show costs amortized over 3–12 months.[1][4][5][7]
Say your total for April is $120,000. It’s tempting to tie that spend to customers closed in April, but that skews the math. If your average sales cycle is 60 days, April spend is more likely to turn into customers who close in June. Get that timing wrong, and you make payback look better than it is while also making growth seem easier to fund than it may be. Match spend to the month customers close, not the month you spend it, and revisit that lag each quarter.[4]
The simple payback formula is:[1][6][2][3]
CAC Payback (months) = CAC per Customer ÷ (Monthly ARPA × Gross Margin %)
Here’s the math. If $120,000 in April spend leads to 40 new customers in June, CAC comes out to $3,000 per customer. If each customer brings in $400 in MRR and gross margin is 80%, then payback is $3,000 ÷ $320, or about 9.4 months.[1][6][3]
This simple version is quick to calculate, which makes it handy for fractional CFO board updates or a fast benchmark check. It works best when ARPA, churn, and expansion stay fairly steady. The catch is simple: it assumes revenue doesn’t change over time. For companies with upsells, downgrades, or churn that hits early, that can paint the wrong picture.[1][4]
When accounts ramp over time or churn has a big effect, simple payback can point you in the wrong direction. In that case, a cohort model gives you a better read on what a specific group of customers actually produces until cumulative gross margin passes the CAC spent to acquire them.[1][4] It also helps you spot whether payback is getting shorter or longer as you grow.
A simple spreadsheet can do the job. Use one row for each monthly cohort and track:
Payback happens when cumulative gross margin moves past cohort CAC.
For example, if a January 2025 cohort has $120,000 in allocated CAC and $30,000 in starting MRR at an 80% gross margin, that cohort adds $24,000 in margin in Month 1. With modest expansion and low churn, cumulative margin could pass $120,000 by Month 6, even if a flat-ARPA model wouldn’t have shown that.[1][4] That kind of view makes the source of slow payback easier to spot: high CAC, low ARPA, weak expansion, or early churn. Use that baseline to set stage-specific payback targets in the next section.

Once you've modeled cohort payback, the next step is setting a target that fits your stage and pricing model.
The key here isn't just knowing the benchmark ranges. It's using your cohort trends to see whether you're actually operating inside them or drifting outside them.
For B2B SaaS, the 2026 median CAC payback sits at 15–18 months, while elite companies recover customer acquisition costs in under 8–10 months[8]. That gives you a solid starting point. From there, set your target based on where the company is today.
| Company Stage | Revenue Scale | Payback Target |
|---|---|---|
| Early/Seed | <$2M ARR | Flexible while testing channels |
| Growth | $5M–$20M ARR | <18 months |
| Late/Scale | >$20M ARR | <15 months |
At around $5M ARR, the bar usually moves. Teams are no longer just testing what works. They're expected to produce consistent payback in under 18 months.
At scale, that window gets tighter. The focus shifts to recovering CAC faster and putting capital to work with more discipline.
Your ACV should shape the payback range.
As a rule of thumb, SMB-led sales usually need shorter payback targets. Enterprise sales can often support a longer recovery window because higher ACV and lower churn change the math.
Put simply: a company selling lower-priced plans can't wait as long to earn CAC back. A company landing bigger contracts may have more room, as long as retention holds up.
Start with the stage benchmarks above. Then set a range that fits your ACV and your capital efficiency goals.
A few ground rules help:
That range should act like a line in the sand for hiring, spend, and runway planning.
CAC Payback Targets by Stage & Scenario: SaaS Growth Planning Guide
Use your payback guardrails to decide when to hire, how much to spend, and how much runway you have left.
Before you approve new headcount, model the hire like an investment. Look at the rep's ramp, quota, and support costs. Start with the monthly cost, map the ramp month by month, set a full-ramp quota - for example, $600,000 in annual new ARR - then apply your gross margin. From there, calculate how many months it takes for that rep's cumulative gross-margin dollars to cover their fully loaded cost plus the marketing spend tied to supporting them.
This makes the hiring call a lot less fuzzy.
If adding two AEs would push your blended CAC payback from 12 months to 20 months, that's a sign to slow down. If payback is moving from 18 months down to 10 months, that's your signal to speed up. The point is simple: make the tradeoff clear instead of hiring on gut feel.
That same approach should also set your S&M budget ceiling.
Work backward from your payback target to set the maximum annual S&M spend tied to new customer acquisition. Once you have that ceiling, pressure-test it against runway.
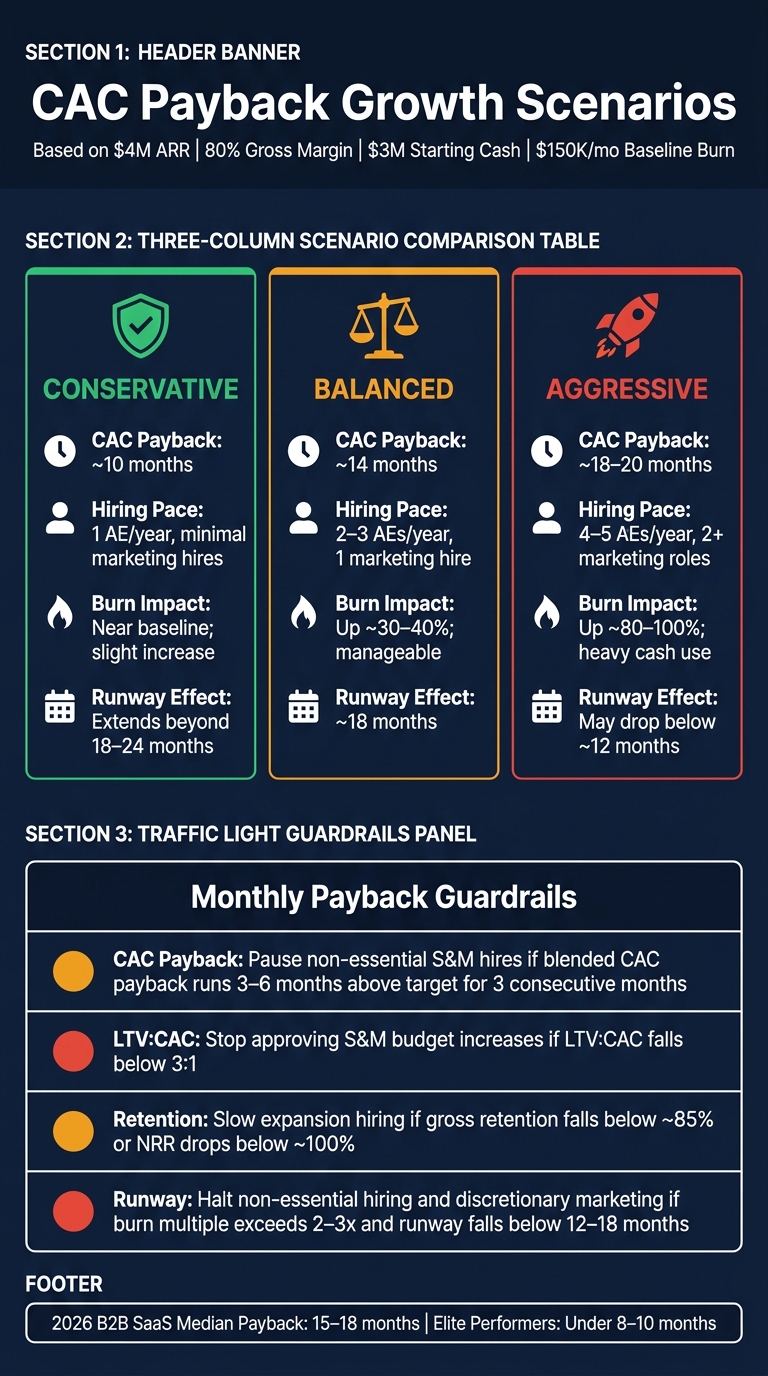
Here’s how different payback assumptions can change the picture for a company at $4,000,000 ARR, with 80% gross margin, $3,000,000 in starting cash, and $150,000/month baseline burn:
| Scenario | CAC Payback | Hiring Pace | Burn Impact | Estimated Runway Effect |
|---|---|---|---|---|
| Conservative | ~10 months | 1 AE/year, minimal marketing hires | Burn near baseline; slight increase | Runway extends beyond ~18–24 months |
| Balanced | ~14 months | 2–3 AEs/year, 1 marketing hire | Burn up ~30–40%; manageable | Around ~18 months |
| Aggressive | ~18–20 months | 4–5 AEs/year, 2+ marketing roles | Burn up ~80–100%; heavy cash use | May drop below ~12 months |
Scenarios like these help founders and boards decide how much CAC payback stretch - and how much cash risk - they're willing to take on for faster ARR growth.
Review CAC payback every month. In the first week of each month, check blended CAC payback, channel-level payback, LTV:CAC, the SaaS magic number, gross retention, net revenue retention (NRR), and burn multiple.
Think of the guardrails like a traffic light. When a metric drifts too far, the action should be clear:
Once you track payback each month, it should guide every growth call you make.
Revenue shows how fast the business is growing. CAC payback shows whether that growth is worth the cash you're putting into it. Sales and marketing spend should earn its way back through gross profit. And when payback is faster, you get more room to reinvest, add headcount, or both. Those benchmarks also shape valuation and capital efficiency.
So the plan should start with payback and then move into hiring, spend, and runway. A payback-based plan connects headcount, budget, and runway to one recovery timeline instead of only chasing a top-line revenue goal. Put payback at the center, and revenue becomes a steadier target.
Phoenix Strategy Group helps growth-stage companies build CAC payback models, FP&A processes, dashboards, and cash plans that support scaling and fundraising. If your model can't answer those questions, fix that first.
Fully loaded CAC includes every sales and marketing cost tied to winning new customers during a given period. That means salaries, commissions, bonuses, ad spend, agency fees, marketing tools, overhead, content production, and onboarding costs.
Leave out costs like sales hire ramp time or deferred marketing spend, and payback can look better than it is. That kind of gap can push a company to spend too much, based on numbers that don’t tell the whole story.
Use a cohort payback model when you need a clearer view of cash timing. Aggregate metrics can hide big differences between customer groups.
This model helps you catch retention, channel, and pricing problems sooner. It also shows how segments like self-serve versus enterprise shape runway and liquidity, and when cumulative gross profit pays back acquisition spend.
CAC payback puts a hard cap on how fast you can hire.
Here’s why: when payback is slow, your sales and marketing spend sits unrecovered for longer. That cash stays tied up, your runway gets shorter, and the margin for error shrinks fast. So founders shouldn’t add headcount just because growth looks within reach. They should hire only when their model shows that payback period and rep ramp time still leave enough cash on hand in a downside case.
In subscription SaaS, payback often lands in the 12–18 month range. That means hiring sales reps, planning ramp, factoring in fully loaded cost, and setting booking targets all need to line up with that recovery window. It also helps to pressure-test the model. A small jump in churn or CAC can push payback past 18–24 months, and that can change the hiring picture in a hurry.