Published on
August 5, 2026


Most CAC benchmarks are wrong the moment you compare the wrong peer group. In B2B SaaS, self-serve CAC can sit near $702, while enterprise sales-led CAC can hit $11,400. If I compare those side by side, I get noise, not a useful benchmark.
Here’s the short version:
A few numbers matter right away:
If I want a clean benchmark, I keep the rules fixed. That means the same spend inputs, the same customer count logic, the same peer set, and the same review cadence every time.
| Area | What I check |
|---|---|
| CAC formula | Spend included, customer counts, reactivations excluded |
| Peer set | ARR, ACV, customer type, vertical, GTM model |
| Timing | Same period, lagged spend if sales cycles are long |
| Channels | Paid, organic, outbound, partner costs split the same way |
| Review rhythm | Weekly pacing, monthly peer check |
Bottom line: I do not benchmark CAC against a broad market average. I benchmark it against a matched peer group, with fixed rules, and I read the result with payback and LTV:CAC, not CAC alone.
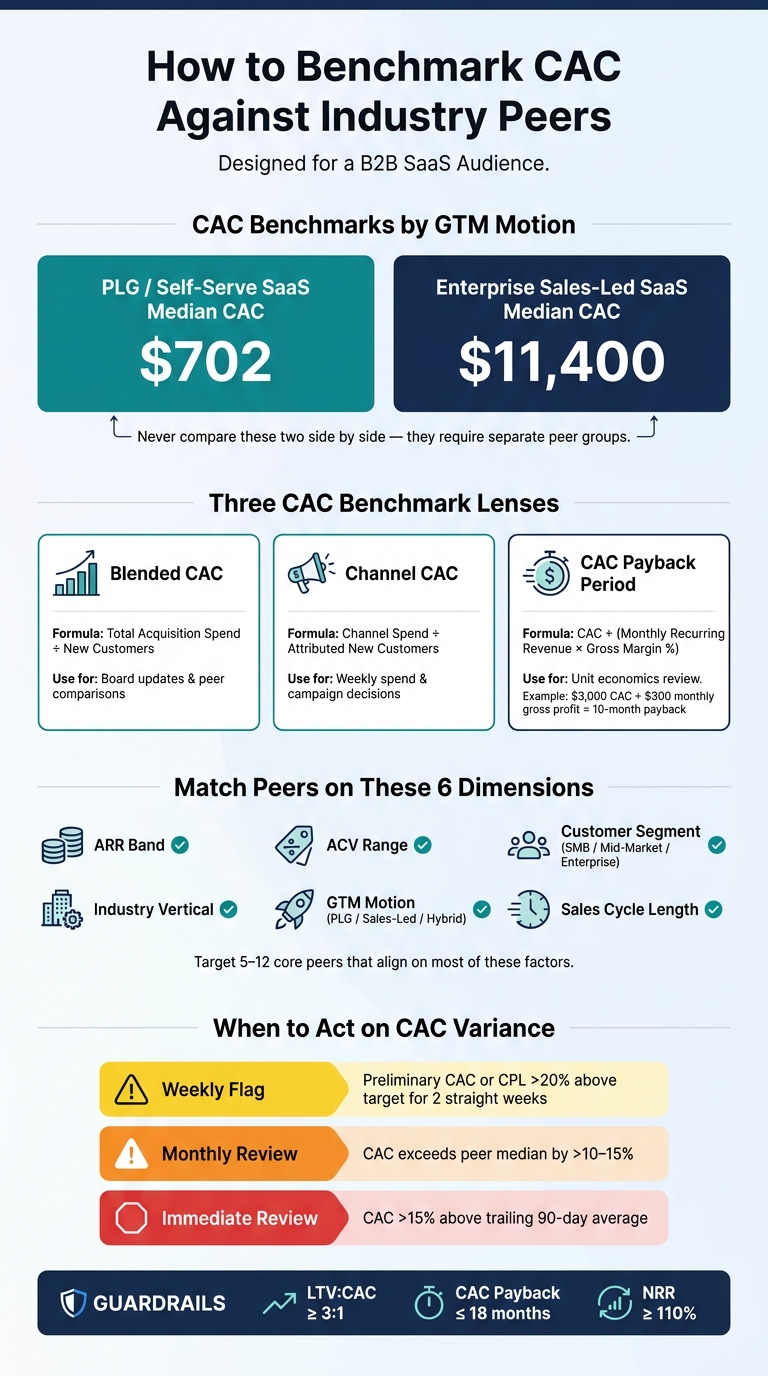
CAC Benchmarking Framework: Key Metrics, Thresholds & Peer Filters

CAC benchmarks fall apart when two companies use the same label for two different formulas. One team counts ad spend only. Another folds in sales salaries, commissions, SDR costs, and part of its marketing tools bill. Both call it CAC, but that side-by-side view doesn't tell you much.[4][6]
The base formula is simple:
CAC = Total acquisition spend ÷ new customers in the same period
So if you spend $320,000 to bring in 160 new customers, your CAC is $2,000.[6][7][8][9] After that, the next step is to choose the CAC view that fits the comparison you want to make.
Each lens answers a different question. Put all three in one chart without any context, and things get messy fast.
| Metric | Definition | Formula | Use Case | Common Mistakes |
|---|---|---|---|---|
| Blended CAC | Average cost to acquire a customer across all channels combined | Total acquisition spend ÷ total new customers in period | Board-level trend review; overall efficiency vs. peers | Mixing time periods; excluding salaries; counting expansions or reactivations as new customers |
| Channel CAC | Average cost to acquire a customer from one specific channel | Channel spend ÷ new customers attributed to that channel | Weekly operating decisions; budget allocation; campaign optimization | Weak or inconsistent attribution; ignoring shared spend; comparing channels with different roles |
| CAC Payback Period | Months to recover CAC from gross profit | CAC ÷ (Monthly recurring revenue per customer × Gross margin %) | Subscription and recurring-revenue models; unit economics review | Using revenue instead of gross margin; mixing one-time and recurring revenue; mismatched cohort periods |
Here's the plain-English version:
For example, if CAC is $3,000 and each customer brings in $300 in monthly gross profit, payback is 10 months.[10][11]
Pick one main lens for each audience. Don't bounce from one to another halfway through the discussion.
Most CAC inconsistency doesn't come from bad arithmetic. It comes from fuzzy rules. Shared headcount is a common trouble spot, so assign it with a fixed policy and stick to that policy over time.[5][8]
You also need firm rules for brand spend, onboarding, and reactivations. Include or leave out each category the same way every time. And don't count reactivated customers as new customers.[2][3][4][5][8][1]
Put those rules into a CAC methodology document. Use plain examples with actual dollar amounts so no one has to guess what belongs in the number. Then review the document once a year, or sooner if your business model shifts in a big way. With CAC pinned down, the next move is choosing comparable peers and normalizing the group.
Once you've defined CAC, the next step is simple: compare it only against companies that look like yours.
That means starting with your own company profile before you look outward. Write down your ARR band, median ACV, customer segment, vertical, GTM motion, and average sales cycle length. Those details shape your first peer screen. From there, build a list of about 15–20 possible companies, then trim it down to 5–12 core peers that line up on most of those factors. The key here is to use these filters together, not one by one.[14][15][16]
Each filter matters because CAC changes fast based on deal size, buyer type, and sales complexity. If a company doesn't line up on most of these points, it's probably not a useful benchmark.
| Peer Filter | Why It Matters | Useful Sources |
|---|---|---|
| Revenue Band (ARR) | Similar ARR often means similar brand awareness, marketing budget, and sales headcount | Benchmark reports, press releases, investor decks, SaaS databases |
| ACV Range | Similar contract values make it easier to compare CAC against the right payback expectations | Pricing pages, public case studies, sales team estimates |
| Customer Segment | SMB, mid-market, and enterprise buyers have very different sales cycles and stakeholder counts | Company positioning pages, ICP descriptions, public customer lists |
| Industry Vertical | Regulated or niche industries may need specialized marketing and sales expertise | Industry reports, analyst coverage, company marketing materials |
| GTM Motion | Product-led, sales-led, and hybrid motions usually lead to different CAC patterns | Product signup flows, sales org structure, PLG benchmarks |
| Sales Cycle Length | Longer cycles usually mean more touchpoints and more SDR/AE time | CRM data, sales leader interviews, public commentary |
Don't compare SMB CAC to enterprise CAC. That's apples to oranges. Higher ACV and longer sales cycles can support much higher customer acquisition spend.[17][18][19]
Once you've narrowed the list, check whether the source behind the benchmark is tight enough to support a serious comparison.
Use benchmark data only if the source clearly states the CAC formula, time period, sample, and segmentation. Broad averages can help as a gut check, but they shouldn't drive target setting.
If you're setting CAC targets, changing payback thresholds, or building budget assumptions, use sources with clear definitions. And if part of your model relies on estimates, flag those inputs so anyone reading it knows which numbers are approximate.
Then align the time period and cohort before comparing your results.
Once you pick the right peers, line up timing, cohorts, and attribution before you compare CAC. Otherwise, the numbers may look clean, but the comparison falls apart.
If your sales cycle is 60–90 days, don't pair current-month spend with current-month customers. That mix skews CAC. In this case, lagged spend gives you a better read. For mid-market or enterprise go-to-market motions, this formula tends to work better: CAC = (Marketing Expenses (n-60) + 1/2 Sales Costs (n-30) + 1/2 Sales Costs (n)) / New Customers (n) [20].
Use new logos only, and use that same rule every time you compare. Expansion should only go in the denominator if the peer benchmark also uses blended expansion [20].
A blended CAC can hide what's going on. Say organic is bringing in low-cost customers, while paid is chewing through budget. The average can make things look fine when they aren't. Or the other way around.
That's why it helps to split CAC by channel. Separate paid and organic CAC so high-cost paid channels don't get masked by low-cost organic growth [20].
| Channel | Costs to Include | Customer Count Logic | How to Compare with Peer Benchmarks |
|---|---|---|---|
| Paid (PPC/Social) | Ad spend, agency fees, creative production, landing page tools | Customers directly attributed to paid clicks/conversions | Compare against paid CAC benchmarks [20]. |
| Organic (SEO/Content) | Content production, SEO tools, marketing salaries, organic social management | Customers from organic search, direct traffic, or non-paid referrals | Compare against organic CAC benchmarks [20]. |
| Outbound Sales | SDR/AE salaries, CRM/sequencing tools, data provider fees, overhead | Customers closed via cold outreach or sales-led motions | Compare against outbound sales benchmarks [20]. |
| Referral/Partners | Referral fees, customer credits, partner commissions, discounts | Customers acquired through formal referral programs or partners | Compare against referral program benchmarks [20]. |
Use fully loaded costs for benchmarking: salaries, benefits, tools, and overhead [20]. That way, you're not giving one channel an easier test than another.
Once these inputs are locked, your dashboard can show actual movement instead of timing noise.
With timing, cohorts, and channels lined up, use that same view in your weekly and monthly dashboard.
After you lock in CAC definitions, peer sets, and cohort rules, put the review on a weekly and monthly cadence. The dashboard shouldn't just log numbers. It should help the team make calls: weekly for execution, monthly for benchmark review.
Weekly reviews help you catch issues early. Monthly reviews show whether CAC is lining up with peer benchmarks.
Use weekly metrics to spot drift before month-end. Then use monthly metrics to judge structural performance.
Weekly metrics should center on leading indicators. Watch leads, MQLs, SQLs, opportunities, meetings booked and held, spend pacing, and preliminary channel CAC.
Each metric also needs a clear owner:
A standing weekly review gives each owner a chance to explain variances and commit to next steps. That matters because a number without an owner usually goes nowhere.
Use simple thresholds so the team knows when to dig in. Investigate when preliminary CAC or CPL is more than 20% above target for 2 straight weeks, when lead volume drops more than 15%, or when spend pacing is off by more than 10% from plan [21][22][24].
The weekly review is about execution. The monthly review is about peer comparison. This is where you compare validated CAC against peer medians and ranges. The goal is to spot structural trends, not get distracted by one noisy month.
Your monthly view should include blended CAC, CAC by channel, and CAC payback period. For each one, show three values: your actual number, your internal target, and the peer median.
Use plain variance thresholds to decide when action is needed. A practical starting framework looks like this:
| View | Primary Metrics | Review Owner | Action Trigger |
|---|---|---|---|
| Weekly | Leads, MQLs, SQLs, opportunities, meetings, spend pacing, preliminary CAC by channel | Marketing (leads/MQLs), Sales (SQLs/meetings), Finance (spend/CAC) | Investigate when preliminary CAC or CPL is >20% above target for 2 straight weeks, lead volume falls >15%, or spend pacing misses plan by >10% |
| Monthly | Blended CAC, CAC by channel, CAC payback, peer median CAC, peer range (25th–75th percentile), 6–12 month CAC trends | Finance (benchmark integration), Marketing (channel performance), Sales (conversion drivers) | Deeper review when CAC exceeds peer median by >10–15%; consider structural changes when variance persists >20–25% for 2–3 consecutive months |
When a monthly variance flag goes off, start with one question: why did it move? In most cases, the shift comes from channel mix, pricing or discount changes, conversion drops, or definition mismatches.
Use one source of truth for CRM and ad-platform data so Finance can validate the monthly CAC number. If the inputs don't match, the review turns into a debate instead of a working session.
Track CAC payback every month too. That keeps the team from chasing CAC alone and missing the bigger unit economics picture. PLG SaaS often targets sub-12-month payback, while enterprise sales-led companies may accept 18–30 months when net revenue retention is strong [12][13][23].
If the monthly review flags a variance, pause before you change spend. When the monthly benchmark shows CAC above the peer median, don't go straight to budget cuts. First, run a short diagnostic to see what's behind the gap.
Here are the first checks to run for the most common causes of CAC variance:
| Variance Cause | Check to Run | Typical CAC Effect |
|---|---|---|
| Definition mismatch | Check whether salaries, benefits, and overhead are included, and confirm expansion revenue is excluded from the denominator. | Fully loaded vs. blended CAC can differ by 30–50%; mixing in expansion artificially lowers CAC by a similar margin [25] |
| Cohort timing | Match acquisition spend to the cohort's close month or sales-cycle lag. | Prevents artificial spikes in high-growth months [25] |
| Go-to-market mix | Check channel mix (% of budget in organic vs. paid), ACV band for shifts toward enterprise, and trial-to-paid conversion rate. | Organic CAC averages $942 vs. $1,907 for paid; enterprise CAC runs 2x–5x higher than mid-market; improving conversion from 12% to 18% drops CAC by 33% [25] |
A CAC increase tied to enterprise deals or a heavier paid channel mix may just reflect a different go-to-market mix. That's a very different story from a spike caused by a definition mismatch or a cohort timing error. In that case, the benchmark comparison itself needs another look.
Flag any CAC movement greater than 15% from the trailing 90-day average for immediate review. Use a rolling 90-day CAC instead of a single-month snapshot to smooth out noise and get a steadier read on long-term trends [25].
At the same time, track these guardrails:
Use this same diagnostic sequence every month before changing spend, targets, or staffing. Then rerun the same benchmark in the next monthly review.
Don’t judge CAC by the dollar figure alone. Put it next to your LTV-to-CAC ratio, which shows how customer value over time stacks up against what you spent to acquire that customer. A common healthy benchmark is 3:1.
You’ll also want to track your CAC payback period. That’s the number of months it takes to earn back acquisition costs through customer revenue. A typical target is 6–18 months, depending on your business model and growth stage.
Focus on four factors: sector, ARR or revenue band, business model, and U.S. geography.
Start with GICS or NAICS. That helps you find companies working under similar rules and facing a similar level of competition. It’s the closest thing to an apples-to-apples starting point.
From there, aim for 5 to 10 companies that sit near your size. A good rule of thumb is:
If that group ends up too small, don’t loosen everything at once. Keep sector and revenue band fixed first. Then relax geography or sales motion to widen the pool without drifting too far from a fair comparison.
Review CAC benchmarks on a few different timelines. Track CAC and payback period monthly against your financial plan, and dig into any variance above 10% from your trailing three-month average.
Run a weekly check to spot early movement before it turns into a bigger issue. Refresh peer benchmarks quarterly as new data comes in. Then do a yearly review to make sure your definitions and benchmarks still match your business and market.