Published on
July 30, 2026


If I want a weekly cash forecast that I can trust, I need to do four things every week: start with actual bank cash, update AR/AP/payroll timing, roll the model forward 13 weeks, and review every material miss. That’s the core system.
For a business doing $500,000 to $10,000,000 a year, this matters because cash problems often show up in small weekly gaps, not in one big event. And with many small businesses holding only about 27 days of cash on hand, a late customer payment or early vendor draft can hit fast.
Here’s the short version:
A simple target is to move from about 10%–20% variance toward 5%–10% over time by fixing the same timing errors week after week.
If I had to boil the article down to one idea, it would be this: cash forecast accuracy improves when I stop guessing and start checking each week against actual cash.
A 13-week forecast only works if Monday begins with a clean dashboard. Build that first, so the week starts with current numbers in one place.
Your dashboard needs six core data feeds to show the full cash picture: bank accounts, credit facilities, open customer invoices (AR), vendor bills and due dates (AP), payroll schedules including benefits and employer taxes, and scheduled debt service payments. Skip even one, and the forecast misses a cash movement that matters.
The prior section covered bank, AR, AP, and payroll. The two inputs that add the most structure here are credit facilities and scheduled debt service. Credit lines can hide available headroom and payback duties when they’re left out. Debt service creates fixed cash outflows, and if those payments aren’t mapped to the right week, net cash flow gets warped.[2][4][7]
Once those feeds are connected, the weekly workflow moves much faster because you’re not cleaning up data by hand every Monday.
More metrics don’t lead to better calls. A good dashboard shows the handful that change what you do next.
That core set includes:
A -$15,000 miss on ending cash tells you something went off track. Category-level variance tells you what happened. Maybe collections slipped. Maybe a vendor got paid earlier than planned. Maybe a one-time item, like a legal fee, never made it into the forecast.
Scattered spreadsheets lead to version mix-ups and hand-entry mistakes. The dashboard should be the single source of truth: one screen with a 13-week grid, weeks across the columns and cash lines down the rows. Closed weeks should show actuals. Open weeks should show the live forecast.[2][3][5][6][8]
Once the dashboard is live, the weekly process can begin with actual bank balances.
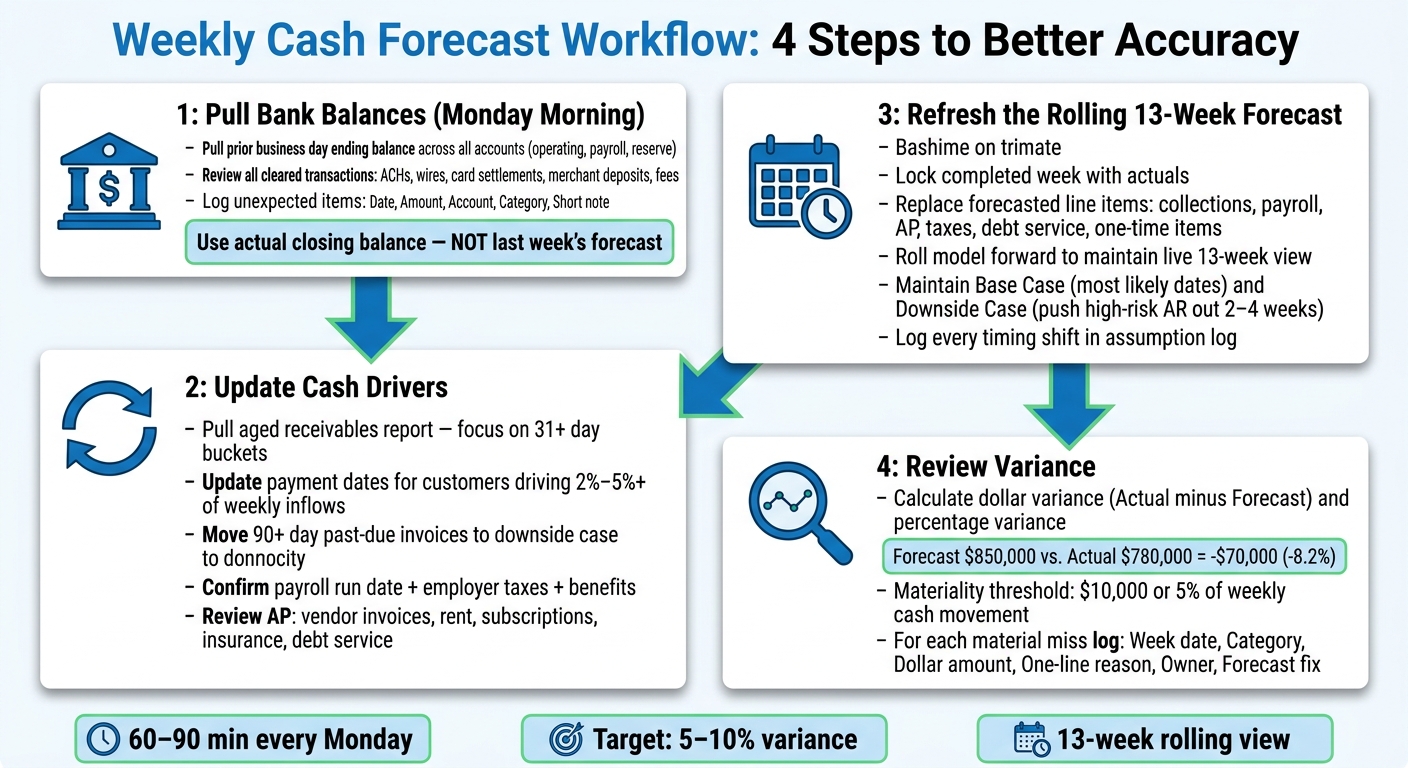
Weekly Cash Forecast Workflow: 4 Steps to Better Accuracy
Once the dashboard is set up, stick to a Monday rhythm to keep it accurate. Most teams can get through this in 60–90 minutes each Monday morning.[2][9][12]
Start by pulling the prior business day's ending balance across all operating, payroll, and reserve accounts. Use that closing balance as your starting cash, not last week's forecast.
Before you touch the model, review every cleared transaction. That includes ACHs, wires, card settlements, merchant deposits, and fees. If something looks material, dig into it right away. Smaller mismatches can wait until later in the week.
Log each unexpected item with:
That short note matters. It gives you a record you can use later when you review forecast variance.
If a transaction shows up as pending in the bank portal but hasn't cleared, keep it in the forecast as a future line item. Don't treat it as an actual yet.
Next, update the assumptions that drive ending cash.
Pull an aged receivables report and pay close attention to the 31+ day buckets. For any customer driving 2%–5% or more of weekly inflows, update the expected payment date based on current status, not just the invoice due date. If a customer tends to pay in 45 days on net 30 terms, the forecast should match that pattern. For invoices that are 90+ days past due or under dispute, move them into the downside case.[2][10][13]
Then turn to cash going out. Confirm the next payroll run date and total cash need, including employer taxes and benefits. After that, review scheduled AP for this week and next: vendor invoices, rent, software subscriptions, insurance, and debt service.
If a contract renewed at a new price or a billing date moved, update the forecast and tag that change as a pricing or billing change. That helps you avoid treating it as a forecast miss later.
Once those drivers are updated, flow the changes into the live forecast.
With actuals confirmed and cash drivers updated, roll the model forward. Lock the completed week and replace forecasted line items with actuals, including collections, payroll, AP, taxes, debt service, and one-time items. Then roll the model forward so you keep a live 13-week view.[9][11][12]
Track every timing shift in the assumption log. That includes a payment pushed out, a collection pulled forward, or a spending cut. Keep each entry to one line with the prior date, the updated date, and the reason.
If collection timing is uncertain for one or more large customers, keep:
That refreshed forecast becomes the baseline for next week's variance review. Then compare the refreshed forecast with actual results to spot the misses.
After you roll the forecast forward, compare it with actual cash and tighten next week’s assumptions. Once the week closes, use actual results to test the forecast, then update the next week based on what happened.
For each major cash driver, calculate two figures: dollar variance and percentage variance. Dollar variance is actual minus forecast.
If forecast ending cash was $850,000 and actual ending cash was $780,000, the variance is -$70,000, or -8.2%.[1][21]
Run the same check for collections, payroll, AP, taxes, debt service, and other major cash drivers. A simple weekly table works well here: one row per week, with columns for forecast, actual, dollar variance, and percentage variance.[22][24] That gives management a fast weekly snapshot.
Set a materiality threshold of $10,000 or 5% of weekly cash movement so the review stays focused on the items that matter most.[17][23]
A variance tells you what happened. The variance log shows why.
For each material miss, record:
Common causes include slow collections, shifted payroll timing, surprise expenses, early vendor payments, financing draws or repayments, and tax items.[17][19][16]
The fix should be just as specific. If collections keep coming in late, change the timing assumption for that customer and move expected receipts into later weeks. If overtime keeps running above plan, increase the overtime assumption instead of calling it a one-off.[17][18]
The point is to update collection timing, payroll timing, AP timing, or tax assumptions so the model matches what’s happening in the business. Otherwise, the review turns into a scoreboard instead of a tool.
Review the log across the full 13-week window and look for repeated misses, not isolated ones. One miss is noise. Repeated misses point to bias.[18][19][20]
If AR collections come in below forecast most weeks, the model is too optimistic about collection timing. If discretionary spending categories keep showing positive variances, those costs are being underestimated each cycle.[18][19]
Keep the variance log in the same operating view as the 13-week forecast. Over time, a well-kept log also builds a track record that shows lenders and investors the forecast is improving based on actual results.[1][25]
Once variance tracking is set up, the weekly process turns into a simple loop you can run again and again. Pull actual bank balances, update AR, AP, and payroll, refresh the 13-week forecast, and review variance.
Forecast accuracy gets better only when every miss is tied to a single assumption and fixed. If the forecast is off, trace that miss back to one assumption and update it.
That kind of improvement does more than tidy up the forecast. A steady cadence, backed by bank data, gives leadership, lenders, and investors more confidence when they need to make hiring, capital spending, and financing calls.
If your team needs help automating bank feeds and pulling financial inputs into one place, Phoenix Strategy Group can support that workflow.
Use variance analysis to pinpoint the cause of forecast gaps, whether that’s timing issues, structural shifts, or flawed assumptions. Put forecasted figures next to actual results on a regular basis so you can see not just where the gaps are, but why they happened.
To cut bias, build multiple scenarios, including a conservative or worst-case model. Then update your assumptions based on what the numbers show. A disciplined weekly update routine helps keep forecasts tied to current performance instead of old expectations.
Don’t look at invoice dates alone.
Use DSO as your starting point for when cash is likely to come in. Then apply probability weights to each accounts receivable aging bucket. For example:
That gives you a more grounded view of collections instead of assuming every invoice will be paid on time.
If a customer starts paying late, adjust the model by moving their receivables into older buckets by hand. It’s a simple step, but it can keep your forecast from drifting too far from what’s happening.
It also helps to run three versions of the model:
This way, you can plan for cash runway with a lot less guesswork.
Focus on variances that point to immediate liquidity risk or a deeper shift in the business, not routine timing noise.
Look closely at gaps between actuals and forecast across the cash items that matter most:
Dig in when cash drops below your three-month fixed-cost reserve, runway falls under six months, or 15%–20% of accounts receivable is more than 45 days past due.
Use green/yellow/red flags to show urgency at a glance.
Green means things are on track. Yellow signals pressure that needs attention soon. Red means the issue needs action now.