Published on
August 4, 2026


If I had to boil this down to one line, it’s this: token design is finance design. If I set supply, vesting, incentives, and utility without tying them to cash burn, runway, and USD reporting, I’m leaving a hole in the model.
Here’s the short version:
A few numbers stand out:
My takeaway: I should treat tokenomics like part of the finance stack, perhaps by leveraging fractional CFO services, not a side document. That means linking supply to runway, utility to revenue, and treasury to cash in one clear USD model.
Web3 Tokenomics vs. Traditional FP&A: Key Metrics at a Glance
Token design has a direct impact on runway. Supply, allocation, and unlock timing decide how many months of USD operating costs the treasury can cover. Once runway is defined, the job is to turn token design into a month-by-month USD coverage model.
Your supply model shapes both cash planning and dilution. A fixed supply can limit dilution, but it can also leave you short on incentive budget. An inflationary supply gives you more room to fund growth, though it can dilute holders if emissions grow faster than utility. A dynamic supply can move with protocol activity, but it's tougher to model and explain. Burn-based supply only matters when burns are mechanically tied to actual usage. [7]
| Supply model | Planning effect | Main risk |
|---|---|---|
| Fixed | Simpler long-term dilution cap | Underfunded incentives if allocations are too tight |
| Inflationary | Flexible ongoing incentives | Continuous dilution if emissions outpace utility growth |
| Dynamic | Reacts to protocol activity | Harder to model and explain to investors |
| Burn-based | Reduces supply with usage | Burns without real utility can look cosmetic |
After supply is set, allocations decide who can claim value and when. Team and advisor grants create future compensation expense. Investor allocations can add sell pressure. Ecosystem and liquidity pools help drive adoption. Treasury reserves fund day-to-day operations.
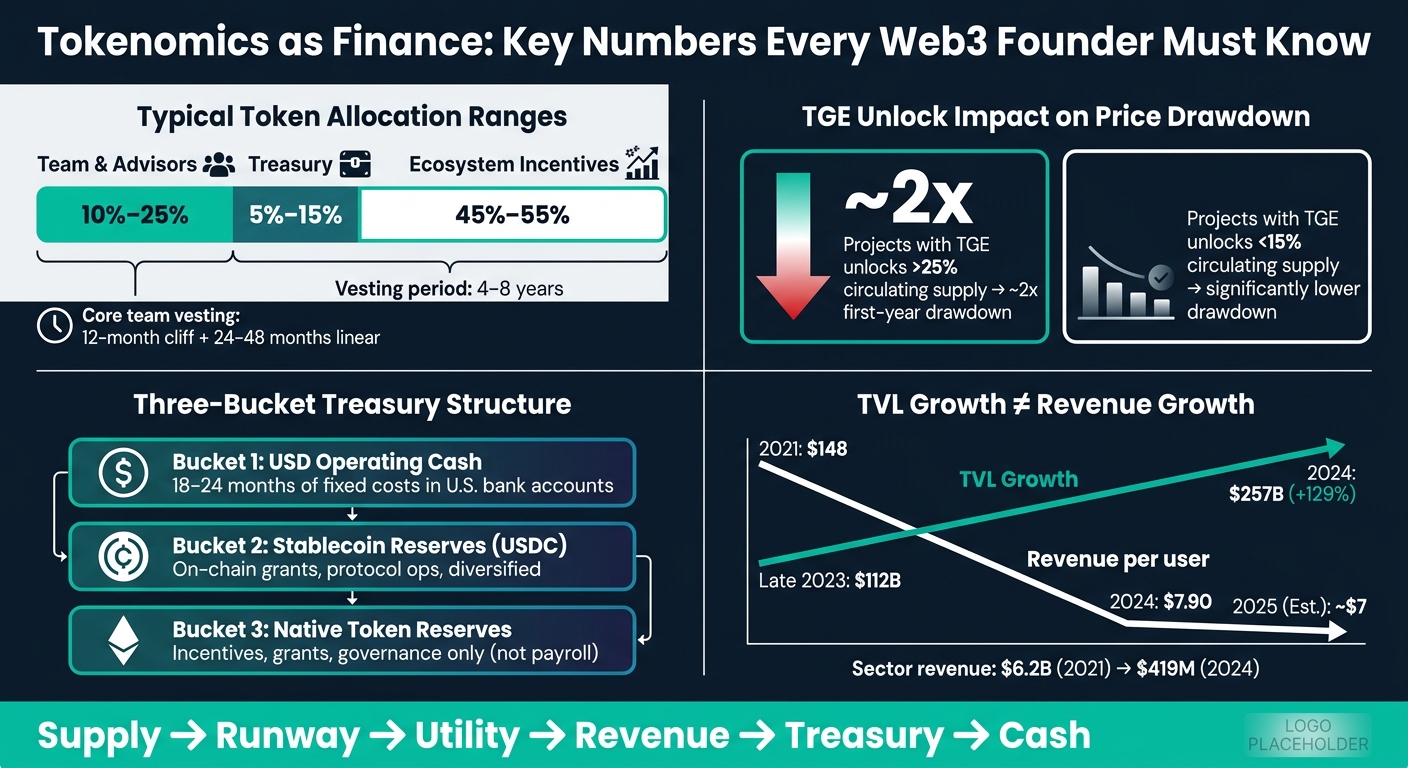
Common setups assign 10%–25% to team/advisors, 5%–15% to treasury, and 45%–55% to ecosystem incentives, often over 4 to 8 years. [4][5][6] A common vesting setup for core team members is a 12-month cliff followed by 24 to 48 months of linear vesting. It also helps to stagger cliffs by stakeholder type: longer for team, shorter for investors, and governance-approved or performance-based unlocks for ecosystem and advisor pools. That lowers near-term unlock pressure and ties insiders more closely to long-term protocol value. [8][9][2]
Build a schedule table for every stakeholder bucket. At a minimum, track:
Then convert projected unlocks into USD using conservative price cases - low, base, and high - instead of relying on one token price.
FDV can make runway look larger than it is because locked tokens are not spendable. Show both FDV and liquid treasury assets. The model should also track emissions and burns alongside vesting, since all three affect circulating supply. That changes dilution, price sensitivity, and the USD value of treasury holdings in any given month. [1][10][7] Those inputs then flow into revenue forecasts, treasury policy, and investor reporting.
After runway, the next thing to pin down is simple: what does the token actually earn? Token utility only matters when it leads to measurable USD revenue or a clear cost.
Each utility type should connect to a specific revenue mechanism, not a broad story about “ecosystem value.” Fee payment utility is the most direct path. Pin down which actions create fees, set the fee base in USD notional value, and define the take rate. Uniswap’s fee switch generated nearly $23 million in protocol revenue in an early measurement period.[11][12][13]
Staking emissions are a cost. Revenue starts only when stakers get a share of protocol fees. Lido is a good example here. Its fee on staking rewards, split between node operators and the DAO treasury, has generated roughly $45 million in annual treasury revenue at specific staking volumes.[14][15]
Other utility types map in a pretty direct way:
It also helps to keep two separate maps:
That split matters. User behavior is not the same thing as revenue recognition. When teams blend the two in board reporting, investors get a distorted view of financial performance. This is where a fractional CFO can help bridge the gap between on-chain activity and traditional financial reporting.
On-chain data is your raw input for the forecast. For transaction-based protocols, monthly protocol fees can be modeled as:
transactions × average transaction value × fee rate
From there, company revenue is just its share of those fees.
For TVL-driven protocols, like DeFi lending or synthetic asset platforms, the formula is different:
TVL × fee APR, monthly
Then split that amount between the company and liquidity providers.
MakerDAO’s real-world asset program shows how large this can get. Its RWA program supported more than $2.5 billion in DAI and generated over $75 million in stability fees in 2023.[16]
Build three scenarios for each main driver: base, bullish, and bearish. Use them for transaction volume, daily active addresses, TVL, and paid actions. That gives the board a range to track instead of one rosy number.
And here’s the trap: TVL growth by itself does not mean revenue growth. DeFi sector TVL recovered from $112 billion to $257 billion (+129%) between late 2023 and 2024, yet sector revenue fell from $6.2 billion in 2021 to $419 million in 2024. Revenue per user also dropped from $148 in 2021 to $7.9 in 2024 and about $7 in 2025.[3] That’s why your scenarios need to focus on fee capture and unit economics, not TVL headlines.
Under ASC 606, token-linked revenue starts with one basic step: identify the performance obligations before anything reaches the income statement. Recognize token-linked revenue only when performance obligations are satisfied and control transfers.[17][18]
If token sale proceeds are tied to future access, record them as contract liabilities (deferred revenue) until the promised service is delivered.[17] Utility tokens tied to platform access are usually recognized over time on a ratable basis.[17]
At a minimum, model three schedules:
That last point is easy to miss. Issuing tokens may change supply, optics, and treasury math. It does not automatically mean the business earned revenue.
Once revenue is mapped, treasury has to turn token activity into something the business can actually use: payroll, runway, and board-ready reporting.
Start with operating cash. Then split out reserve funds and token holdings.
Bucket 1 - USD operating cash: This is the money for payroll, rent, software, legal and accounting, and taxes. Keep 18–24 months of fixed costs in U.S. bank accounts, and top it up through planned stablecoin conversions.[22][24][25]
Bucket 2 - Stablecoin reserves: Use stablecoins such as USDC for near-term on-chain needs, like grants, protocol operations, and payments to counterparties that settle on-chain. Spread reserves across more than one stablecoin type to cut concentration risk.[23]
Bucket 3 - Native token reserves: Treat native tokens as strategic reserves for incentives, grants, and governance, not as payroll funding. These reserves should match planned emissions and unlocks, not day-to-day cash needs. If too much of the treasury sits in the native token, a downturn can force sales at the worst time.
Forecast in U.S. dollars first. That way, the model shows actual spending power instead of a token balance that may swing all over the place.
A solid monthly forecast should begin with opening cash, then add expected fiat revenue, stablecoin inflows, and planned token conversions. From there, subtract payroll, vendors, taxes, and grants.
Every forecast should also include downside cases. Model what happens if token prices fall 25%, 50%, or more. Then check whether the treasury still covers 6–12 months of operating expenses in each case.
On the accounting side, U.S. GAAP now has a rule built for this. ASU 2023-08, which takes effect for fiscal years starting after December 15, 2024, requires fair value measurement for in-scope crypto assets at each reporting date. Changes must be recognized in net income, and these assets must be shown separately from other intangible assets.[19][20][21] Talk with your accountant early, because treatment may differ depending on whether tokens are held for investment, inventory, or day-to-day use.
Keep a detailed ledger for token holdings by wallet, cost basis, acquisition date, restrictions, and intended use. Reconcile on-chain balances to the general ledger every month. Put clear controls in place for who can move funds, who approves token conversions, and how transfers are recorded.
Use the same drivers across monthly close, board reporting, and investor diligence. Investors in tokenized companies want more than a standard income statement. A strong monthly package should cover:
| Reporting Area | What to Include |
|---|---|
| Token schedule | Total supply, pool allocations, vesting terms, emissions schedule |
| Unlock calendar | Upcoming unlocks by stakeholder group, dates, and amounts |
| Treasury composition | USD value by asset class: cash, stablecoins, and native tokens |
| Runway | Months of operating expenses covered under base and downside scenarios |
| Protocol fee revenue | Fees earned in USD and how they flow into revenue |
| Usage metrics | Active addresses, transactions, TVL, or paid actions used in revenue assumptions |
| Financial statement bridge | Reconciliation from on-chain balances to reported holdings and the income statement |
Most teams skip the bridge between token activity and the financial statements. That’s a mistake.
The report should connect token movements to the numbers investors see: sale date, USD proceeds, fees, cash balance, and runway. This gives investors a straight line from token economics to operating performance. It also helps keep the story focused on the business, not just the token price.
Feed these schedules into the monthly FP&A model and the close process.
Once token supply, utility, and treasury rules are set, bring them into one monthly operating model. Use one integrated model, not separate token and USD budgets. The point is simple: show how token decisions affect cash needs, revenue timing, and investor messaging by tying budget, runway, revenue, and treasury together in one place.
A founder-ready model should include separate but connected tabs for the USD P&L, cash flow statement, balance sheet, token supply schedule, vesting and unlock calendar, treasury movements, and scenario analysis. Keep a central assumptions tab with the main drivers so every case pulls from the same source. That usually includes headcount and compensation by function, token emission schedule and vesting cliffs, treasury inflows and outflows with conversion timing, expected protocol usage, and token price assumptions.
Scenarios matter because they turn token shocks into cash and runway outcomes. Run at least three cases: base, downside, and upside. A 50% token price drop is a good stress test. Each unlock date should map to its expected cash impact, dilution, and runway effect. So if 8% of supply unlocks next quarter, the model should show the cash need, price risk, and investor messaging impact, not just leave it as a token footnote on the side.[26][22]
The KPI dashboard should put operating metrics and on-chain data next to each other, with a clear focus on monthly decisions. Track monthly fee revenue, gross and net burn, runway in months, unlocked supply, and protocol fee rate. Keep it decision-oriented, not stuffed with reporting clutter.
| Model Tab | Core Inputs |
|---|---|
| USD P&L & Cash Flow | Headcount, burn by department, fee revenue, stablecoin inflows |
| Token Supply Schedule | Emission rate, total supply, circulating supply by month |
| Vesting & Unlock Calendar | Cliff dates, unlock amounts by stakeholder group |
| Treasury Movements | Token sales, stablecoin conversions, grant outflows |
| Scenario Analysis | Token price cases, adoption curves, fundraising timing |
| KPI Dashboard | Burn, runway, unlocked supply, protocol fee rate |
Refresh the model every month so unlocks, treasury moves, and fundraising changes show up right away. Also refresh it after unlocks, treasury trades, grants, or fundraising events.[22][27][28]
Model architecture, bookkeeping, on-chain reconciliation, and investor reporting call for finance support with the right skill set.
Phoenix Strategy Group provides fractional CFO services, FP&A, bookkeeping, data engineering, and cash flow forecasting with FP&A, bookkeeping, and on-chain reconciliation expertise. That matters because token assumptions do not do much on their own. They need to flow into budgets, runway, and investor reporting. For a Web3 startup heading into a fundraise or dealing with a major unlock cycle, that setup makes it much easier to connect token assumptions to disciplined USD reporting and investor communication.
Tokenomics becomes fundable only when it is translated into a connected USD operating model. The three planning links founders cannot ignore are supply to runway, utility to revenue, and treasury to cash. Strong teams can trace every token assumption to a budget, a runway impact, or a revenue line.
Token unlocks can change liquidity and runway because they add to circulating supply. That shift can affect market behavior, investor sentiment, and how much treasury value is on hand to fund operations.
Founders should build unlocks into a 12-month rolling cash forecast and treat them as moving inputs, not fixed assumptions. Scenario modeling makes this easier to see. It shows how treasury values after an unlock can change cash reserves, burn rate, and coverage for payroll and growth spending.
Token utilities drive USD revenue only when they have a direct effect on customer acquisition, retention, or pricing power. The simplest way to judge that is to connect each utility to your core revenue formula, like Price × Subscribers.
That keeps the conversation grounded. Instead of treating token utility as its own lane, map it to the business levers that already matter.
Focus on utilities that help you keep customers longer, cut churn, or justify higher pricing tiers. Then model each mechanism through operating drivers such as conversion rate, repeat purchases, or subscriber retention.
In plain English: don’t measure token utility as a side project. Measure it by how it changes unit economics.
Keep a cash reserve that covers 3 to 6 months of operating expenses. A lot of growth-focused businesses also set aside 10% to 15% of total cash so they have room to move during market downturns or periods of fast growth.
The right reserve depends on your burn rate, planned investments, and shifts in the market. If your monthly burn is $400,000, that may mean holding $6 million to $8 million in reserve, backed by a rolling 12-month forecast.