Published on
July 30, 2026


A wind project is only worth what its permits, grid path, revenue contract, and debt terms can support. If I were screening a deal today, I’d focus first on four things: site and permit status, interconnection timing and upgrade cost, PPA and merchant price exposure, and turbine output versus forecast.
Here’s the short version:
If those items are weak, the valuation should come down. If they check out, I can put more weight on the cash-flow model and deal price.
This checklist is a simple way to sort open items into three buckets: what is closed, what can change price, and what can stop closing.
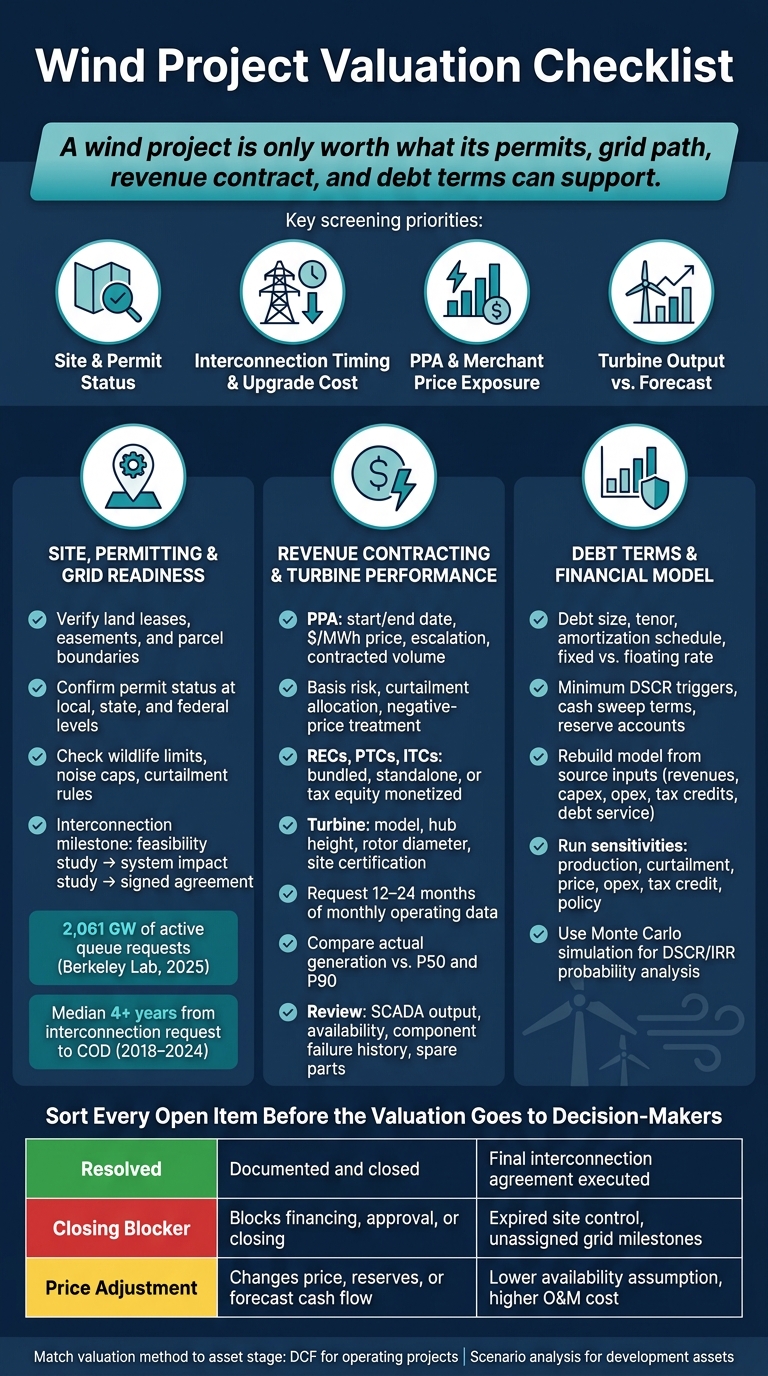
Wind Project Valuation Checklist: 4-Stage Due Diligence Framework
After you define the asset and choose a valuation method, the next step is simple: make sure the site can actually support the model. If site control is shaky, permits are still hanging in the air, or interconnection is stuck in line, project value can drop fast.
Start with the land. Check that leases, easements, and parcel boundaries line up with the current project layout. The lease term should cover the full operating life of the project, not just the build phase.
It also helps to map landowner duties, setbacks, and land-use limits against the layout in use today. A mismatch here can cause headaches later. And if site control is weak or the wind data comes in below plan, that should show up right away in a higher risk discount. From there, look at whether any of those land terms could slow permitting or make construction harder.
List every permit and environmental review the project needs at the local, state, and federal levels, then match each one to its current stage. Any permit that is still open needs a timeline that fits the construction schedule.
This is where details matter. Wildlife limits, noise caps, curtailment rules, and local pushback can all delay COD or cut modeled energy output. State rules tied to Renewable Portfolio Standards, noise, and setbacks differ from one place to another, and those shifts can change project value [2].
Interconnection status is often the main factor in whether a project makes it to construction [1]. So don’t settle for a vague update. Confirm the exact milestone: feasibility study, system impact study, or a signed interconnection agreement. A signed agreement and firm milestone dates reduce risk.
Then review the full scope of electrical work the project has to pay for, including network upgrades, substation work, and system reinforcements [1]. Queue congestion is one of the biggest delay risks in the market, and it can also push costs higher [2]. Interconnection costs can be small fees in some cases or run into the millions when grid capacity is tight [1].
Once site and grid risk are clear, move to offtake terms and turbine performance.
Once site and grid risk are clear, the next step is cash flow. In practice, two factors matter most: how the power is sold and how dependably the turbines generate it.
Start with the PPA. Check the start date, expiration date, tenor, $/MWh price, annual escalation, contracted volume, extension options, and whether the price applies to all expected generation or only part of it. If only part of output is covered, pin down what share of expected generation is left exposed to merchant pricing after the PPA ends or beyond the contracted volume.
Then look at how settlement works. Review the settlement point, basis risk between the project settlement point and hub price, curtailment allocation, negative-price treatment, and the amount of output that still sells at merchant prices.
Tax credits and renewable attributes can shift project economics fast, so check those closely too. Confirm whether RECs, PTCs, and ITCs are bundled, priced on their own, already monetized through tax equity, or changed by transfer rules.
Now get into the machines themselves. Confirm the turbine model, hub height, rotor diameter, commissioning date, and whether the turbine is certified for the site’s wind class, temperature range, and icing conditions. A turbine can be up and running and still be a poor fit for the site. When that happens, output can lag the forecast in ways that don’t jump off the page in a model.
Ask for 12 to 24 months of monthly operating data and compare actual generation against P50 and P90. Then review:
Use these cash-flow checks to see whether the financing structure and model still hold up. Then move to the next step: test debt terms and reserve accounts against that cash flow.
Once cash flow checks out, the next step is simple: see if the debt stack can handle a bad-case scenario. Debt terms can change equity returns in a big way, so they need to line up with the project's cash flow.
Start with the core loan terms:
Then look at the covenants. Confirm the minimum DSCR, cash sweep triggers, and cash reserve terms. Also check that reserve accounts are sized the right way and tested against downside cases. A downside sensitivity review helps show how often DSCR or IRR drops below the target.
After the debt terms are pinned down, rebuild the model and check that the structure still holds up under stress.
Rebuild the model from source inputs so you can catch mapping mistakes before they turn into bigger problems. Revenues, capex, opex, tax credits, and debt service should all tie out in a monthly model built from source drivers.
Next, run sensitivities. Test production, curtailment, price, opex, tax credit, performance, policy, and refinancing assumptions against equity value and debt coverage. Standard sensitivity tables help, but they don't show the whole picture. That's where Monte Carlo simulation comes in. It helps measure the probability of missing DSCR or IRR targets [3].
Write down the main assumptions, sensitivities, and breakpoints in the investment memo. Phoenix Strategy Group can help with model review, FP&A discipline, and transaction readiness.
Run one last diligence check before you rely on the valuation. Start by making sure the highest-risk assumptions are documented, up to date, and easy to trace.
Then line up the valuation method with the asset stage. Use DCF for operating projects. For development assets, use scenario analysis with weights tied to development risk.
After that, pressure-test the constraint most likely to move the deal: interconnection timing. This can't sit in the footnotes. It needs to be treated as a core valuation input. Berkeley Lab's 2025 interconnection queue analysis reported 2,061 GW of active requests, with a median timeline from interconnection request to commercial operation date of over 4 years for projects built between 2018 and 2024[4][5]. If interconnection milestones are still unresolved, that uncertainty needs to show up in the valuation.
Finish with an issues log that sorts every open item before the valuation goes to decision-makers. The goal is simple: separate clean items from the ones that can change price, timing, or whether the deal closes at all.
| Category | What it means | Example |
|---|---|---|
| Resolved | Documented and closed | Final interconnection agreement executed |
| Closing blocker | Blocks financing, approval, or closing | Expired site control, unassigned grid milestones |
| Price adjustment | Changes price, reserves, or forecast cash flow | Lower availability assumption, higher O&M cost |
Once the log is complete, the valuation is ready for decision-makers. Keep it short, specific, and ready for action.
Valuation shifts at each project stage because risk drops as development moves forward. At the greenfield stage, value comes mostly from site control, early environmental work, and room to shape the project. This is the riskiest point, and there’s the least certainty.
By the pre-NTP and shovel-ready stages, the picture changes. At that point, value leans more on permit status, interconnection security, and progress on offtake. Once a project is operating, valuation centers on steady cash flow, production history, and O&M optimization.
Interconnection risks can have a direct effect on wind project value because they shape feasibility, cost, and revenue stability.
The biggest factor is often a project’s spot in the interconnection queue. Projects that are further along usually face shorter timelines and fewer surprises. That makes planning a lot easier, especially when financing, construction, and power sales all depend on the grid connection staying on track.
The main risks tend to fall into a few areas:
Taken together, these issues can change both the timing and the economics of a wind project.
P50 and P90 help set expected cash flow. And cash flow is what drives valuation and financing.
P50 is the median production case. P90 is the more conservative case, and it’s usually the one lenders lean on when they want more confidence that debt can be repaid.
That split matters. Equity investors usually focus on P50 because they care about the base-case upside. Lenders usually focus on P90 because they care more about downside protection.
DSCR measures debt coverage. If the deal looks riskier, the required DSCR can go up. When that happens, leverage often goes down. And lower leverage can squeeze levered IRR, which may push the deal price down.