Published on
August 10, 2026

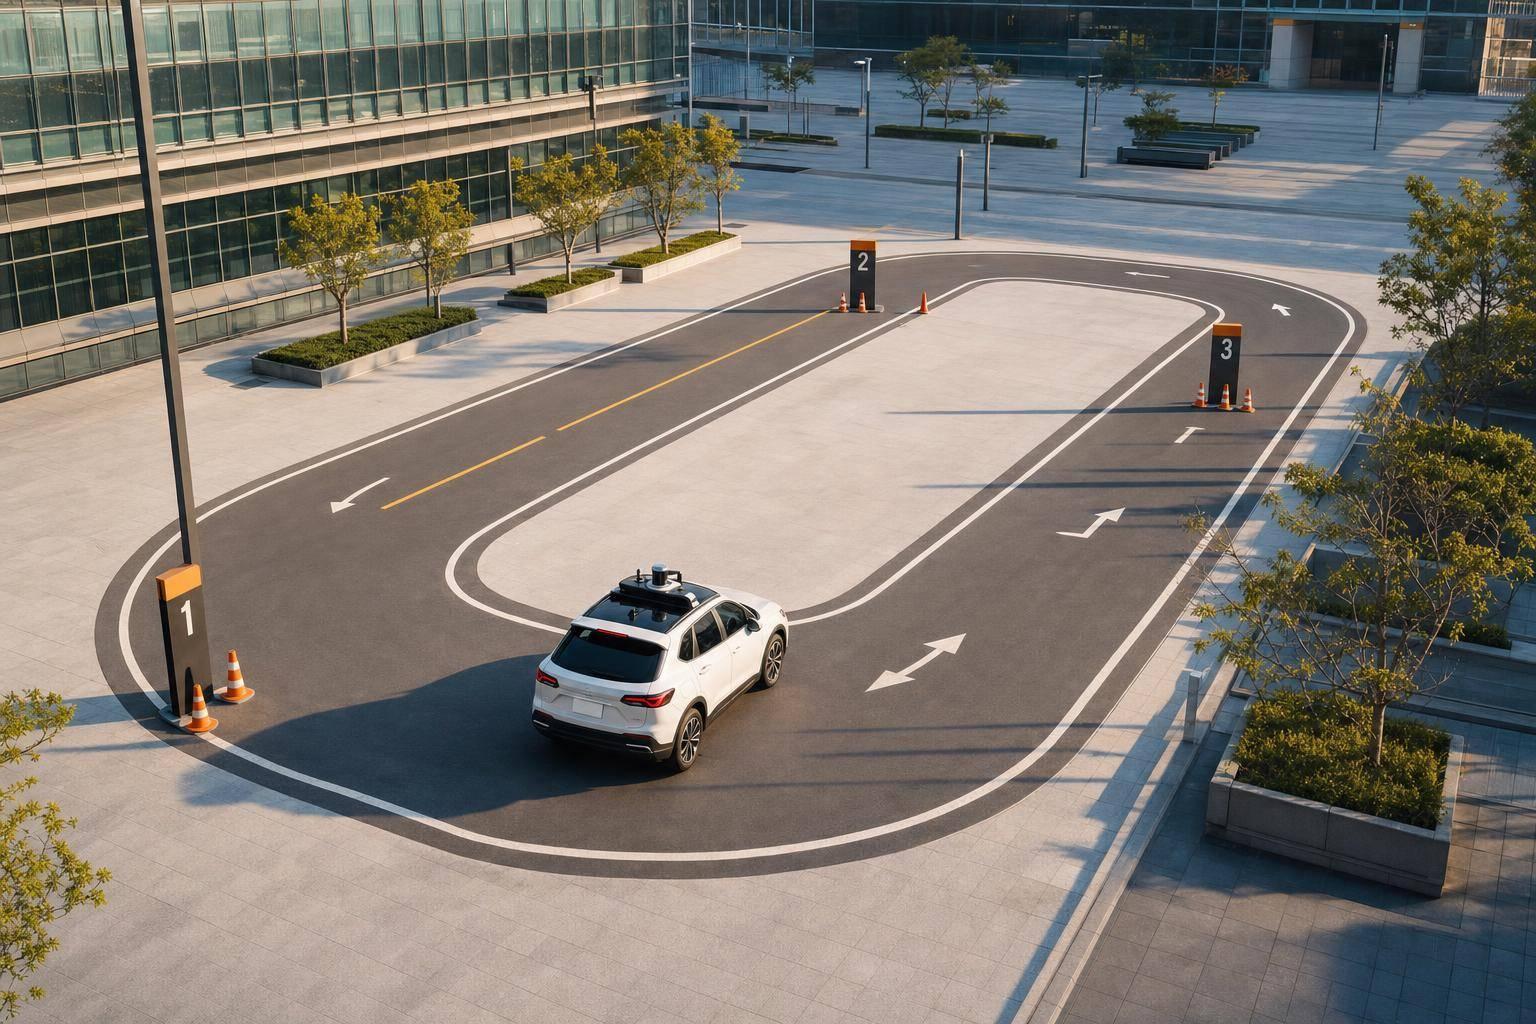
If I were building in AV today, I would not start with robotaxis. The best founder wedge is usually a narrow use case, a clear buyer, and a model that does not eat cash before revenue shows up.
Here’s the short version:
A few numbers stand out. The AV market is projected to grow from $145.42 billion in 2025 to over $1 trillion by 2034. Waymo reported 200,000+ rides per week across four U.S. cities. Autonomous delivery can cost about $0.18 to $0.22 per mile versus $0.85 to $1.10 per mile for human courier service. And software plus autonomous driving systems already make up 45.3% of the market.
If I had to boil the full guide down to one line, it would be this: <u>pick a tight domain, match the capital plan to the deployment model, and prove the economics early.</u>
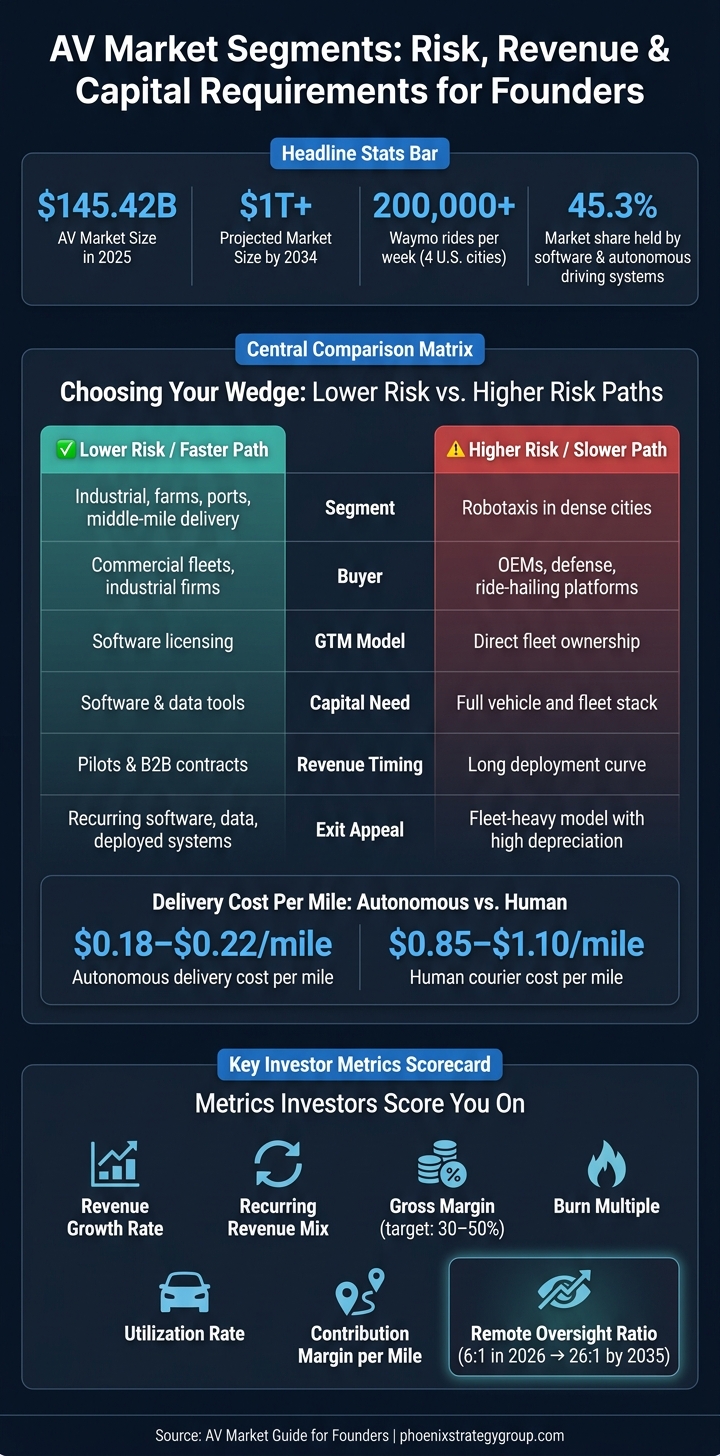
AV Market Segments: Risk, Revenue & Capital Requirements for Founders
| Area | Lower Risk / Faster Path | Higher Risk / Slower Path |
|---|---|---|
| Segment | Industrial, farms, ports, middle-mile delivery | Robotaxis in dense cities |
| Buyer | Commercial fleets, industrial firms | OEMs, defense, ride-hailing platforms |
| GTM | Software licensing | Direct fleet ownership |
| Capital Need | Software/data tools | Full vehicle and fleet stack |
| Revenue Timing | Pilots and B2B contracts | Long deployment curve |
| Exit Appeal | Recurring software, data, deployed systems | Fleet-heavy model with high depreciation |
So when I read the AV market as a founder, I do not ask, “How big is AV?” I ask, “Which slice can I sell into now, with a sales cycle and cost base I can survive?”
Not every AV segment is at the same stage. Some can bring in revenue today. Others are still waiting for the market, the tech, or regulators to catch up.
Robotaxis get most of the headlines. But they also sit behind the highest technical and regulatory wall because they need to handle dense city traffic. Waymo has reached 200,000+ autonomous rides per week across four U.S. cities [2]. That’s a big milestone. Still, for most founders, robotaxis are a hard place to start.
Autonomous trucking looks very different. Highway freight is far more predictable than downtown driving, and the business case is easier to see. Robotruck software can cut fuel and operating costs by about 10% [3]. Companies like Aurora and Kodiak have pushed toward a per-mile autonomy service model. Instead of owning the trucks, they provide the hardware and software stack to fleet owners and charge a per-mile fee. That takes some of the fleet ownership burden off the customer.
Goods delivery splits into two lanes:
Both depend on narrow, repeatable routes. That matters. It lowers the complexity. Starship Technologies passed 10 million kilometers driven and 5.5 million successful deliveries by April 2023, mostly on university campuses [3]. Gatik went fully driverless on middle-mile Walmart routes in Arkansas in November 2021, operating 12 hours a day, seven days a week on fixed warehouse-to-distribution-center routes [3].
Industrial and off-road automation - in ports, mines, and farms - is often the easiest first market for founders. These deployments run in controlled settings and are already producing commercial value today [1]. The regulatory load is lower than it is on public roads, and the work is repetitive enough to support early revenue.
Enabling stack companies - LiDAR, radar, chips, mapping, and data infrastructure - sell into every other segment. And the data load is huge. A fleet of just 50 vehicles can generate 100 petabytes of data over three years [1]. That creates direct demand for storage, processing, and the tooling needed to manage AV data at scale.
What separates these segments most isn’t just the tech. It’s the buyer, the cost to build, and how fast revenue can cover that spend.
The buyer changes almost everything: sales cycle, integration work, and the amount of proof you need before anyone signs.
OEMs and Tier 1 suppliers license autonomy software to place inside vehicle platforms. These can become the biggest contracts on the board, but they move slowly and ask for deep integration. A startup selling into an OEM should expect 3 to 5+ years from the first meeting to production deployment.
Commercial fleets - especially logistics operators focused on cost per mile and labor gaps - are usually more open to pilots than OEMs. Their sales cycle is often 1 to 2 years, and the main integration job is connecting your system to fleet management software already in use.
Industrial buyers in mining and agriculture are often the most direct path to a signed deal. They work on private land, the safety and productivity case is easy to explain, and they face fewer regulatory hurdles. Setup still depends on the site, but the sales story is plain.
Ride-hailing operators care most about labor cost and need deep app and dispatch integration. Defense buyers can offer large contracts, but they also bring the longest timelines and the toughest technical bar.
| Buyer Group | Typical Deal Size | Sales Cycle | Integration Burden | Primary Business Case |
|---|---|---|---|---|
| OEMs | Very large | 3–5+ years | Extreme | Product differentiation and safety ratings |
| Tier 1 Suppliers | Large | 2–3 years | High | Embedding autonomy into existing systems |
| Commercial Fleets | Medium to large | 1–2 years | Moderate | Cost per mile and labor reduction |
| Industrial (Mining/Ag) | Medium to large | 1–2 years | High | 24/7 uptime and hazardous-environment safety |
| Ride-Hailing Operators | Large | Pilot-based | High | Reducing driver labor costs |
| Defense | Large | 3+ years | Very high | Personnel risk reduction and reconnaissance |
For early-stage companies, the shortest route to revenue is often in industrial settings and middle-mile logistics. Those markets are less exposed to the messiness of public-road deployment, and that changes the kind of company a founder can build. In many cases, it also decides whether the business can stay relatively light on capital with fractional CFO services or has to take on fleet-heavy operations.
Once the segment is clear, the next big founder call is capital structure. And in AV, that choice usually comes down to one thing: how much hardware the business carries.
Software-heavy companies that license autonomy stacks to OEMs or fleet operators can usually make venture capital go further. Their burn is driven mostly by engineering headcount and cloud spend. Hardware-heavy AV platforms are a different story. They often need strategic investors that can support years of deployment before unit economics settle down. For founders, the core issue is simple: can the business pay for deployment before revenue catches up?
Most teams begin with venture capital. Then, as they move toward scale, they layer in strategic capital and asset-backed debt tied to vehicles or fleets, once cost per mile is low enough for lenders to underwrite. Public listings usually make sense only after a company can show proven unit economics across a meaningful number of vehicles, not just a promising pilot [4].
Grants and defense contracts also matter, especially for founders building specialized AV for reconnaissance and transport. They don't create dilution, which is a big plus, and they can help fund early R&D. The tradeoff is that they often move slowly and come with narrow scope requirements.
A top-tier robotaxi costs about $85,000 per vehicle, and the autonomy stack - sensors, compute, and software - can account for more than 35% of that total. LiDAR is usually the biggest line item. That cost mix has a direct effect on how much outside capital a company needs before it can scale.
AI-heavy AV systems also need far more compute and storage than earlier models. In many cases, they require 10x more GPU compute and up to 17x more data storage [1]. That doesn't just hit one budget line. It adds recurring costs for cloud usage, simulation, and retraining as fleets grow.
Insurance is another fixed cost that founders often underestimate. As fleets expand, telematics-based commercial policies replace individual driver underwriting, and premiums reflect the liability exposure of operating driverless vehicles on public roads. On top of that, companies still need remote monitoring staff, HD map updates, and system revalidation after road changes. All of that adds to operating overhead.
For investors, contribution margin is the number to watch. It shows whether the direct operating model gets better as scale increases.
| Funding Path | Stage | Dilution | Repayment Risk | Best Fit |
|---|---|---|---|---|
| Venture Capital | R&D / Early Pilot | High | Low | Software-heavy startups, sensor innovators |
| Strategic Capital | Pilot / Scale | Medium | Low | Hardware-heavy AV platforms |
| Grants / Defense | R&D | None | Low | Specialized AV for reconnaissance and transport |
| Equipment Financing | Commercial Scale | Low | High | Fleet operators with proven cost-per-mile data |
| Public Markets | Commercial Scale | Medium | Moderate | Mature operators with demonstrated unit economics |
Founders heading into a fundraise or a strategic partnership need to explain more than today's cost per mile. They need to show how that number drops as the fleet grows and as fewer remote operators are needed per vehicle. That's the metric lenders and investors use to judge whether the business can scale without getting messy. It also shapes a basic operating choice: run fleets, license software, or use some mix of both.
How a founder goes to market affects almost everything that follows: when revenue shows up, what margins look like, how much cash the business needs, and even what kind of buyer may want it later. In plain English, GTM choice shapes both funding needs and exit appeal.
With direct fleet operations, the company owns the customer relationship end to end. That means more control over the user experience and direct access to the data that comes with every trip. The tradeoff is cost. HD mapping, geofencing, and vehicle depreciation can drive years of cash burn before unit economics settle into something workable.
Software licensing takes a different route. Instead of building a rider base from scratch, AV firms can plug into demand that already exists. That keeps spending centered on the autonomy stack instead of fleet logistics. The margin profile can look much closer to SaaS. The downside is that the company gives up some control and, over time, some access to direct customer data.
A third option is idle-vehicle sharing. Here, privately owned autonomous vehicles are put to work when they would otherwise sit unused. That matters because private vehicles average only about 10% utilization today [5]. Put differently, most of the asset is idle most of the day. This setup can cut platform cash needs in a big way and may scale faster than an owned-fleet model, though dispatch gets harder when vehicle availability changes from one owner to the next. Using underused private autonomous vehicles also improves asset efficiency and overall mobility service quality [5].
There’s also a practical lesson here. Even firms that mainly license software should keep some kind of direct customer channel, such as their own app. Waymo does this alongside third-party partnerships to keep first-party data and avoid total dependence on one demand aggregator [1].
These decisions don’t just affect revenue timing. They also shape what the company may be worth in a sale.
Strategic buyers tend to care less about headline revenue and more about three things: data, proof of deployment, and the mix of software in the business.
Large proprietary datasets and trained models sit near the center of that value. If a buyer can shorten its path to market by buying data and model training rather than building it all in-house, that can change the whole deal logic.
Proof of deployment matters just as much. Fully driverless public miles, run without safety attendants in dense urban areas, are one of the clearest signals that a system is ready to scale [4]. Then regulation adds another layer. Commercial operating permits in states like Arizona or Texas matter more than plain testing permits because they show the company can generate revenue now, not someday.
The Cruise permit suspension showed how fast one safety event can wipe out value [4].
Valuation also changes with software mix. Companies with recurring software revenue and higher gross-margin revenue tend to get better multiples than pure fleet operators that carry heavy depreciation. And hardware still matters. The AV hardware and sensor systems segment is projected to reach $200 billion by 2030 [1], which makes hardware IP a real target for OEMs and Tier 1 suppliers that want tighter control of their supply chains.
One thing buyers and investors don’t want to guess at: the numbers. Clean financials should separate software revenue from fleet revenue and show how contribution margin improves as the business scales. Without that, even a strong story can fall flat in a fundraise or strategic talk.
| GTM Model | Revenue Timing | Gross Margin Potential | Operating Risk | Cash Needs |
|---|---|---|---|---|
| Direct Fleet Operations | Delayed (years to scale) | Lower | High (liability, maintenance) | Very High |
| Software Licensing | Faster (via existing channels) | High | Low | Low |
| Idle-Vehicle Sharing | Moderate | Moderate | Moderate | Minimal |
| Hardware / Sensors | Moderate (B2B sales cycles) | Moderate | Moderate | High |
Those same operating choices show up in lender and investor diligence. One metric is worth extra attention: the remote oversight ratio. It asks a simple question: how many vehicles can one human operator supervise? That ratio is modeled to move from 6:1 in 2026 to 26:1 by 2035 [4]. If a company can show a believable path along that curve, it has a much stronger case that labor won’t grow at the same pace as fleet size.
| Metric | Why It Matters |
|---|---|
| Revenue Growth Rate | Signals market traction and demand velocity |
| Recurring Revenue Mix | Higher software mix improves valuation multiples |
| Gross Margin | Vertical integration can support 30%–50% gross margins but requires more capital [4] |
| Burn Multiple | Measures capital efficiency relative to revenue growth |
| Utilization Rate | Percentage of time the vehicle is generating revenue instead of sitting idle [5] |
| Contribution Margin per Mile | Shows whether direct operating economics improve with scale |
| Remote Oversight Ratio | Vehicles per human operator; shows whether labor can scale slower than fleet size [4] |
| Safety Record | Tracks driverless miles per incident versus human-driver benchmarks [4] |
| Regulatory Exposure | Reflects commercial permits held, not just testing permits, across jurisdictions [4] |
After mapping segments, buyers, funding, and GTM, the founder’s job gets simple in theory and hard in practice: narrow the wedge and prove unit economics.
The AV companies that win don’t try to do everything at once. They start tight. That means picking a narrow subsegment, choosing a clear buyer, and using a capital structure that fits deployment cost. In a market like this, focus isn’t a nice-to-have. It’s the whole game.
Buyer type shapes more than the pitch. It changes the sales cycle, the integration load, and when cash comes in. Pick the wrong buyer, and even a strong product can get stuck in long pilots, messy procurement, or slow payment.
Once the buyer is locked in, the capital stack needs to fit the deployment model. That means matching equity, strategic capital, or debt to hardware intensity and unit economics. If the financing model fights the business model, things get expensive fast.
Founders also need to define the ODD with precision before fundraising. Investors price risk based on weather, speed, road type, and traffic density. If those boundaries are fuzzy, the risk picture is fuzzy too.
With the operating boundary set, the next job is building financial reporting that investors will trust. Phoenix Strategy Group helps growth-stage AV companies build the financial discipline needed for fundraising and exit planning.
At the end of the day, investable AV businesses are the ones that prove a narrow use case, measurable safety, and improving economics.
Start by lining up your technical strengths with a clear market need. AV isn't just about robotaxis. There are also openings in logistics, long-haul trucking, farming, mining, and defense.
You also need to choose where you sit in the stack: full-stack technology, licensed software, or core hardware like sensors and semiconductors.
AV startups often burn about $1.6 million per month. So when you plan your funding, the total amount needs to cover your runway plus extra room for delays and downside cases.
That buffer matters more than it might seem. In this space, timelines can slip by 1–2 years, and that kind of delay can change cash needs by millions of dollars.
You also need to account for regulatory and compliance costs. NHTSA estimates those costs can range from $2.2 billion to $5.0 billion per year, or about $135–$300 per new vehicle.
Investors in autonomous vehicles tend to focus on risk management and whether the business can make money at scale.
That means they look hard at safety performance data, including incident logs, certification status, and testing protocols. They also review cybersecurity and supply chain resilience, because a strong product can still run into trouble if systems are exposed or parts become hard to get.
On the financial side, they closely track cash runway, burn rate, and unit economics. In plain terms, they want to see how sensor costs, insurance, and compliance shape profitability - and what that means for the path to commercialization.