Published on
July 23, 2026


If sales and marketing don’t use the same funnel, your CAC number is probably off. For B2B firms in the $500,000 to $10 million range, that problem gets expensive fast - especially as CAC has gone up 40% to 60% since 2023.
Here’s my simple take: if you want lower CAC, I’d start with four things first:
I’d also watch the numbers that matter most:
A few mistakes drive bad CAC math:
For me, the core point is simple: lower CAC usually starts with alignment, not more budget cuts. Once teams share definitions, handoff rules, reporting, and pay plans, it gets much easier to see which channels and accounts are worth the spend.
B2B CAC Alignment: SaaS vs. Services Team Structure & Metrics
How you set up your team has a direct effect on customer acquisition cost. A good setup cuts waste. A bad one quietly drives CAC up through duplicated work, bad lead routing, and messy reporting.
A shared ICP is the profile both sales and marketing use to decide which accounts to go after. It shouldn't live in one team's head or in a forgotten slide deck. Sales and marketing need to build it together in planned workshops, with marketing bringing campaign data and sales bringing win/loss patterns from the field.
That ICP should spell out:
For services firms, add engagement type and minimum contract value too. Review the ICP every quarter, then tie campaign targeting and outbound lists to it.
Next, put those qualification rules into your CRM lifecycle. Keep the definitions plain and shared across teams. MQL should mean ICP fit, a valid contact, and meaningful engagement. SQL should mean a validated need, budget, authority, and a 90-day decision window.
Use SAL as the step between MQL and SQL. Sales should accept or reject the lead within 48 hours and log the reason in the CRM. If sales rejects it, the reason needs to be a structured field such as "No budget", "Wrong industry", "Too small," or "Not urgent." That makes patterns easy to spot, which helps marketing tighten targeting instead of guessing.
Once the ICP is set, turn it into CRM qualification rules.
After the rules are in place, both teams should work from the same scorecard.
Keep the KPI set short. Cost per SQL, MQL-to-SQL conversion rate, pipeline velocity, win rate by source, CAC by channel, CAC payback period, and LTV:CAC cover the core picture.
Review leading indicators weekly:
Then review lagging metrics monthly in a cross-functional session with finance included. That monthly view should cover CAC by channel, payback, and LTV:CAC. Use one dashboard, owned by RevOps or finance, so everyone is looking at the same numbers.
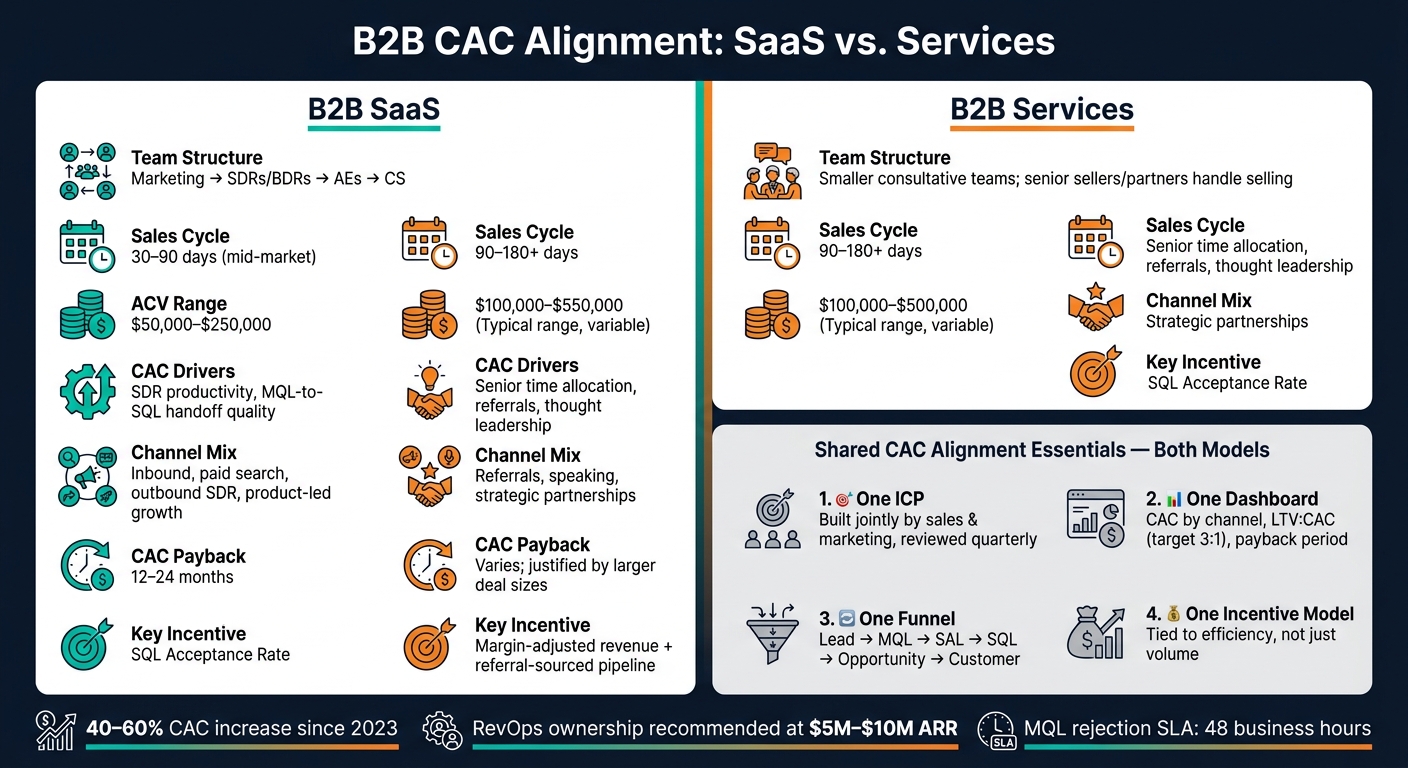
The same alignment model won't look the same in every company. SaaS and services firms usually need different team shapes.
| Factor | B2B SaaS | B2B Services |
|---|---|---|
| Typical team structure | Marketing → SDRs/BDRs → AEs → CS | Smaller consultative teams, with senior sellers or partners handling much of the selling |
| Sales cycle | 30–90 days (mid-market) | 90–180+ days |
| CAC drivers | SDR productivity, MQL-to-SQL handoff quality | Senior time allocation, referrals, and thought leadership |
| Channel mix | Inbound, paid search, outbound SDR, product-led growth | Referrals, speaking, strategic partnerships |
| CAC payback | Often 12–24 months | Varies; higher CAC can be justified by larger deal sizes |
For SaaS founders, CAC efficiency often comes down to SDR output and AE capacity. As ACV moves into the $50,000 to $250,000 range, the setup often shifts. Teams may use fewer SDRs, more senior AEs, and dedicated solutions consultants. That can mean higher CAC per deal, but the unit economics can still work if qualification stays tight.
For services firms, the sales motion is more consultative and relationship-led. Marketing spend is usually lower, with more focus on thought leadership and referrals. Delivery and sales should feed win/loss patterns and use-case gaps back into targeting, so the team doesn't drift toward poor-fit accounts.
When reporting, routing, and attribution start to slip, a dedicated RevOps function often becomes the group that keeps shared CAC ownership in place. That point usually shows up around $5 million to $10 million in ARR, when multiple segments or channels make CRM data shaky without one clear owner.
A shared funnel means sales and marketing own the same pipeline. Not separate scorecards. Not separate goals.
When that doesn’t happen, marketing chases MQL volume while sales chases closed deals. The gap between those two goals is where CAC starts to climb. Every fuzzy handoff burns rep time, slows conversion, and adds more cost to each customer.
The standard B2B funnel looks like this: Lead → MQL → SAL → SQL → Opportunity → Customer.
The point is simple: build one shared pipeline, not two disconnected views of performance. Each stage should also have clear entrance and exit rules. Otherwise, a stage change is just someone clicking a button in the CRM.
| Stage | Entrance Criteria | Exit Criteria |
|---|---|---|
| Lead | Form fill or list upload | Meets ICP fit and confirmed intent |
| MQL | ICP fit confirmed plus an intent signal, such as a pricing page visit or demo request | Sales accepts the lead within the SLA window |
| SAL | Sales acknowledges the lead and opens a contact sequence | Discovery confirms need, budget, authority, and timeline |
| SQL | Discovery confirms a qualified buying process with confirmed pain, budget range, timeline, and decision process | Opportunity record created with deal value and a mutual next step |
| Opportunity | Documented potential deal value and expected close date logged in CRM | Signed agreement and initial invoice booked in finance |
| Customer | Contract signed; revenue booked | LTV tracking begins |
Some teams tweak this a bit. SaaS teams may add a PQL inside MQL. Services teams may split Opportunity into Discovery Complete and Proposal Sent for internal tracking.
Once the stages are set, leads need to move through them on a clock.
SAL is the handoff checkpoint.
Sales should accept or reject every MQL within 24 business hours, log a reason code, and begin outreach right away if the lead is accepted. For demo requests or pricing-page conversions, the response window should be 5 to 15 minutes during business hours, with a 1-hour maximum. For lower-intent leads, like content downloads, same-business-day contact is a solid standard.
Each handoff should come with the context sales needs from the start:
That context matters. When sales gets it upfront, discovery calls can stay focused on qualification and solution fit instead of basic detective work. That shortens the sales cycle and cuts sales effort per closed deal.
Feedback loops fall apart when the data is messy.
Sales should be required to choose a closed-won or closed-lost reason from a standard CRM picklist. Common categories include No budget, Chose competitor, Missing feature, Not ICP, and Timing, plus a short free-text field for extra context. Rejected MQLs should follow the same pattern with standard rejection codes, so marketing can spot which channels are driving poor-fit traffic.
A monthly joint pipeline review keeps this useful. Sales and marketing should look at stage-by-stage conversion rates, channel performance, win/loss patterns, and rejection code trends together.
Here’s where this gets practical: if a paid search campaign shows a strong cost per lead but also a high rate of Not ICP rejections and weak MQL-to-SQL conversion, that’s a pretty direct signal. Shift budget toward channels that bring in better-fit leads, even if raw lead volume drops.
Then roll those patterns back into CAC reporting and attribution each month.
When there isn't one shared source of truth, sales, marketing, and finance end up with three different CAC numbers. And once that happens, progress stalls. People stop talking about what to fix and start arguing about whose spreadsheet is right.
That usually starts with bad handoffs. If lifecycle stages aren't defined the same way across teams, the data falls apart fast. So CAC reporting needs to run on the same lifecycle definitions that sales and marketing already agreed on.
A good CAC dashboard stays tight on purpose. You don't want a giant report that looks impressive and gets ignored. You want a small set of numbers both teams can sit down and review together.
At a minimum, your dashboard should include these views:
| Metric | What It Tells You | Primary owner |
|---|---|---|
| CAC by channel | Where acquisition is efficient or wasteful | Marketing (campaign/spend data) |
| CAC by segment | Which customer type is cheapest to win | RevOps (CRM segmentation) |
| Cost per SQL / opportunity | How much top-of-funnel spend produces sales-qualified leads and opportunities | Marketing + Sales |
| CAC payback period | How many months to recover acquisition cost from gross profit | Finance |
| LTV:CAC ratio | Whether acquisition economics are sustainable long-term | Finance + RevOps |
| Stage conversion rates | Where leads are dropping out of the funnel and how long they stay there | RevOps |
Use that same dashboard to review channel spend, funnel conversion, and booked revenue. That keeps CAC decisions tied to pipeline decisions instead of letting each team work from its own version of the story.
It also helps to build two versions of the dashboard:
Attribution shows which channels and touches drove a customer. The model you pick affects budget decisions and can make CAC look lower or higher than it should.
| Attribution Model | Accuracy | Complexity | Best Fit | CAC Decision Risk |
|---|---|---|---|---|
| First-touch | Low–medium | Low | Early-stage teams focused on demand creation with a small number of channels | Over-credits awareness channels and under-values closing activities |
| Last-touch | Medium | Low | Simple funnels, limited tracking, or when CRM reliably captures opportunity source | Over-weights capture channels like branded search and can starve top-of-funnel programs |
| Multi-touch | Medium–high | Medium–high | Growth-stage companies with multiple channels, longer buying cycles, and RevOps support | Risk of more precision than the data supports; can obscure which 1–2 channels actually drive pipeline |
For most B2B teams, last-touch at the opportunity level is the easiest place to start. It's simple and usually good enough to get the team moving. Then you can add first-touch at the lead level as a second lens.
Multi-touch makes sense later, once you have steady UTM tracking, clean CRM data, and one clear owner for maintaining the model. Until then, it's smart to treat attribution as directional. It points you in the right direction, but it shouldn't pretend to be perfect.
Pipeline numbers and finance numbers need to match. If the CAC in your board deck doesn't line up with the CAC in your operating dashboard, the meeting gets hijacked. Instead of making decisions, everyone spends half the time sorting out the mismatch.
The practical fix is a monthly data pipeline. RevOps exports closed-won opportunities from the CRM with source, segment, and owner. Finance exports booked revenue and gross margin by customer from the accounting or ERP system. Then a mapping table connects CRM opportunity IDs to finance customer IDs.
That link makes cohort reporting possible. You can calculate CAC and payback by group instead of relying on one blended average. For example, "LinkedIn-sourced mid-market customers acquired in Q3 2025 had a CAC of $10,000, a 10-month payback, and 130% net revenue retention after 12 months." [2] That's the kind of detail that leads to a useful board discussion.
For cadence, run a weekly operating review that lasts 60–90 minutes with the founder, head of sales, head of marketing, RevOps, and FP&A. That review should use a short operating dashboard covering new leads, MQLs, SQLs, pipeline created vs. target, pipeline coverage, key conversion rates, and directional CAC by channel.
Then use monthly reconciliation to tie CRM activity, bookings, and gross margin back to that same cohort view.
Once shared funnel metrics are in place, compensation and planning need to push teams toward that same CAC target. If marketing and sales look at the same numbers but get paid for different behavior, CAC tends to creep up.
Compensation should reward efficient growth, not just more activity. And the metrics behind those incentives should come straight from the shared dashboard from the previous section.
| Incentive Structure | Metric Used | Behavior Encouraged | Potential Impact on CAC |
|---|---|---|---|
| Quality-Linked Bonus | SQL Acceptance Rate | Marketing optimizes for lead quality; sales wastes less time on poor-fit leads. | Lowers CAC by cutting sales time spent on unqualified leads. |
| Efficiency-Based Commission | CAC Payback Period | Sales and marketing prioritize channels and segments with faster returns. | Improves cash flow by ensuring acquisition spend is recovered faster. |
| Value-Based Incentive | LTV:CAC Ratio | Teams focus on high-value accounts over easy wins. | Keeps CAC proportional to long-term revenue, not just closed volume. |
| Margin-Adjusted Bonus | Gross-margin-adjusted revenue | Discourages discounting; rewards deals that hold margin after close. | Lowers effective CAC by ensuring acquired revenue carries strong contribution margins. |
This matters more than it may seem at first glance. If marketing is paid on raw MQL volume, they’ll send more names. If sales is paid only on closed volume, reps may chase deals that look good now but carry weak margin later. Shared incentives help both teams pull in the same direction.
Budget and headcount decisions also need to follow that same CAC view. Engaging fractional CFO services can provide the strategic oversight needed to manage these complex trade-offs. Siloed planning is one of the fastest ways to push CAC higher.
Quarterly planning should connect sales capacity, pipeline targets, and marketing budget in one quarterly planning meeting. That gives leaders one place to pressure-test whether spend, hiring, and pipeline goals still line up.
A few rules help keep the view grounded:
That last point is easy to miss. If you judge spend by the quarter when revenue lands instead of the cohort that created it, performance can look better or worse than it actually is.
The same alignment rules show up differently in SaaS and services.
For B2B SaaS, the highest-leverage incentive is often SQL acceptance rate. When SDR and marketing compensation is tied to accepted SQLs instead of raw MQL volume, ICP targeting usually gets tighter fast, and sales spends less time on poor-fit leads. Budget reviews should also track CAC payback by channel, because paid and outbound costs stack up fast at scale.
For B2B services firms, senior seller time is usually the scarcest resource. In that setup, compensation should reward margin-adjusted revenue and referral-sourced pipeline, where CAC is often lowest. Planning cadence also needs to reflect longer sales cycles - often 90 to 180+ days - so spend is matched to the cohort it closes, not the quarter when the deal was booked.
Reducing CAC starts with a single operating system: one ICP, one funnel, one dashboard, and one incentive model.
When those pieces line up, CAC gets a lot easier to control and repeat.
Alignment cuts CAC when both teams work from the same definitions, the same data, and the same goals. Phoenix Strategy Group helps growth-stage companies connect FP&A, data, and revenue reporting so CAC stays visible as they scale.
Your CAC can be off when Finance and RevOps work separately. In that setup, teams often use a simple formula that leaves out overhead, salaries, or commissions. The result looks clean on paper, but it doesn't show the full cost of getting a customer.
It can also drift out of line if you leave out one-time costs, ignore sales-cycle timing, or lump customer success expenses into acquisition spend. Those details matter. Miss one, and your CAC may look lower or higher than it should.
To keep the number in check:
CAC reporting should be a shared job across finance, marketing, and sales.
Regular reviews help these teams work like one decision engine instead of separate silos.
Add a formal RevOps function as your business grows and starts to scale. At that stage, marketing, sales, and customer success need shared goals, steady forecasting, and automated workflows to keep things running smoothly.
It also makes sense when finance and revenue teams need to work from a single source of truth. That becomes a lot more important once manual reporting can’t keep up with lead volume, sales velocity, and campaign performance.