Published on
September 21, 2026


If you run a company between $500,000 and $10,000,000 in revenue, you likely don’t need more reports. You need a live view of cash, burn, runway, and sales.
I’d sum the whole guide up like this: connect your finance data, track a short list of KPIs, keep a 13-week cash forecast, run a monthly forecast update, and use the same numbers for leadership and board reporting. That matters because many small businesses hold only 27 days of cash, and 25% have 13 days or less.
Here’s the plain-English version:
A short side note: this isn’t about making finance look more advanced. It’s about knowing, this week, whether you can hire, spend, wait, or start a fundraise.
| Area | What to have in place | How often |
|---|---|---|
| Cash control | 13-week cash forecast | Weekly |
| Planning | 12- to 18-month forecast | Monthly |
| Reporting | KPI dashboard + variance review | Weekly / Monthly |
| Data | GL, bank, billing, CRM, payroll | Auto-sync where possible |
| Decision-making | Base, upside, downside cases | Before major moves |
| Accountability | KPI dictionary + owner list | Kept current |
If I were putting this into action, I’d start with one goal: make the numbers usable before they are pretty.
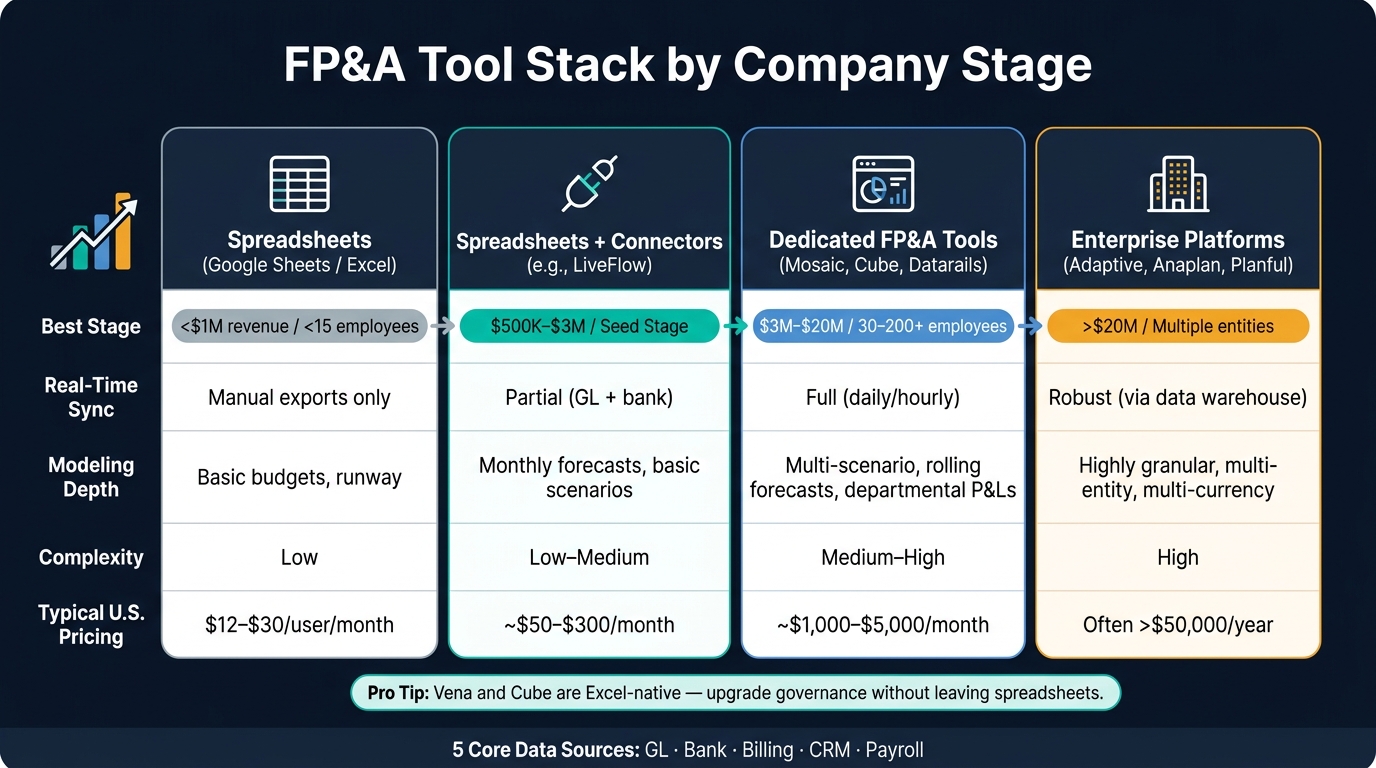
FP&A Tool Stack by Company Stage: Features & Pricing Guide
To produce a weekly dashboard, cash forecast, and variance package, you need one connected data stack. At the core, FP&A depends on five systems: the GL, bank accounts, billing, CRM, and payroll.
The GL in QuickBooks Online, Xero, or NetSuite gives you reconciled actuals, including the P&L, balance sheet, and AR/AP aging. Daily bank feeds from Chase or Bank of America, pulled through Plaid or direct bank connections, show cleared transactions and current balances. Stripe or Chargebee adds forward-looking revenue data through MRR, churn, and invoice status. HubSpot or Salesforce brings in pipeline value and win probability. Gusto or Rippling fills in headcount, gross pay, employer taxes, and benefits, which are often some of the biggest cost drivers in SaaS and tech P&Ls.
A simple way to sequence the work:
Manual exports can work for monthly reporting. But once a team needs weekly or daily visibility, that approach starts to crack. Around $1 million to $3 million in annual revenue, manual CSV pulls can eat up hours of finance time every week, and one changed header or missing row can break the model.[2][3]
Once the model is connected, the next step is figuring out how much tooling the business actually needs.
The right tool depends on company stage and reporting complexity. A startup with fewer than 15 employees doesn’t need the same setup as a multi-entity company with department-level planning and board reporting.
| Tool Type | Best Stage | Real-Time Sync | Modeling Depth | Complexity | Typical U.S. Pricing |
|---|---|---|---|---|---|
| Spreadsheets (Google Sheets / Excel) | <$1M, <15 employees | Manual exports | Basic budgets, runway | Low | $12–$30/user/month |
| Spreadsheets + connectors (LiveFlow) | $500K–$3M, seed stage | Partial (GL + bank) | Monthly forecasts, basic scenarios | Low–Medium | ~$50–$300/month per connector tool, plus spreadsheet licenses |
| Dedicated FP&A tools (Mosaic, Cube, Datarails) | $3M–$20M, 30–200+ employees | Full (daily/hourly) | Multi-scenario, rolling forecasts, departmental P&Ls | Medium–High | ~$1,000–$5,000/month |
| Enterprise platforms (Adaptive, Anaplan, Planful) | >$20M, multiple entities | Robust (via data warehouse) | Highly granular, multi-entity, multi-currency | High | Often >$50,000/year |
One practical note: platforms like Vena and Cube are Excel-native, so your finance team can keep modeling in Excel while adding governance, workflow, and audit trails on top.[4][5] For lean finance teams that already live in spreadsheets, that’s often the easiest upgrade path.
With the right stack in place, leadership can spend less time chasing data and more time making weekly decisions.
Phoenix Strategy Group works with growth-stage companies to set up bookkeeping and accrual accounting, then connects bank feeds, payroll, and billing systems into a real-time financial model. The focus is clean data, shared metric definitions, and a structure built for decision-making.
The end result is an Integrated Financial Model that syncs live data and supports board reporting, cash forecasting, and scenario planning. For companies that aren’t ready to hire a full-time CFO, that setup makes the dashboard and KPI layer much faster to build.
Once the data stack is live, use it to build dashboards, KPIs, and a reporting cadence.
An executive dashboard should not show everything. It should answer three simple questions: Do we have cash? Are we growing at a sane cost? Where is risk starting to build?
For a company with $500,000 to $10 million in revenue, the dashboard should fit the key numbers on one screen: cash balance, weekly cash burn, months of runway, ARR or MRR, pipeline coverage, gross margin, and headcount [10][11][13][15]. That setup gives leaders what they need to make calls on hiring, spending, or hitting pause.
Each metric should show current, prior, and plan. That way, the team can spot gaps in seconds instead of digging through a spreadsheet.
Not every metric needs the same refresh schedule. Some numbers move fast and can change a decision overnight. Cash balance, AR/AP aging, collections status, and pipeline coverage should update daily or weekly because they can shift fast and affect spending and hiring calls right away [11][12][16].
Other numbers need month-end close to mean much. Gross margin, final revenue recognition, EBITDA, and detailed expense categories fall into that bucket because they depend on reconciled actuals. A simple label like weekly estimate vs. month-end final helps avoid confusion between early figures and confirmed numbers.
The goal here isn't to report activity for the sake of it. The goal is to connect growth to cash efficiency.
Track ARR, MRR, MRR waterfall, CAC, LTV, CAC payback, NRR, gross margin, burn, and runway together [6][7][8][9][13]. When those numbers sit side by side, leadership can see fast whether growth is coming at a cash cost the business can handle, or whether it is burning too much for what it is building.
Standard formulas matter more than many teams think. Metric drift is a common problem in early-stage reporting. That's when MRR means one thing to finance and something else to the board. Once that happens, trust starts to slip.
The table below lays out the core KPIs, how to calculate them, where the data comes from, how often to update them, and what decision each one supports:
| Metric | Definition / Formula | Data Source | Update Frequency | Decision Use |
|---|---|---|---|---|
| MRR | Normalized monthly recurring revenue from active customers, excluding one-time fees | Billing or subscription system | Weekly / Daily | Growth momentum |
| ARR | MRR × 12 | Billing or subscription system | Weekly / Daily | Investor and board benchmarking |
| MRR Waterfall | Beginning MRR + New + Expansion + Reactivation − Contraction − Churned = Ending MRR | Billing or subscription system | Monthly | Diagnose growth quality |
| CAC | (Sales + Marketing Spend) ÷ New Customers Acquired; fully loaded with relevant overhead | General ledger + CRM | Monthly | Sales efficiency |
| LTV | (Average MRR per customer × Gross margin %) ÷ Monthly churn rate | Billing + general ledger | Monthly | Unit economics |
| CAC Payback | CAC ÷ monthly gross profit per customer, in months | Billing + general ledger + CRM | Monthly | Capital efficiency |
| NRR | Retained recurring revenue from the same customer cohort after expansion and churn | Billing or subscription system | Monthly | Retention and expansion quality |
| Gross Margin | (Revenue − COGS) ÷ Revenue | General ledger | Monthly close | Pricing and cost structure |
| Burn Rate | Monthly cash outflows minus cash inflows from operations, excluding financing | Bank feeds + general ledger | Weekly / Daily | Spending decisions |
| Runway | Cash balance ÷ Monthly net burn | Bank feeds + general ledger | Weekly / Daily | Hiring and fundraising timing |
A connected data stack and a clean KPI set only matter if reports show up on a schedule people can trust. For most growth-stage companies, the best rhythm has three layers: a weekly KPI snapshot, a monthly financial package, and a quarterly board pack [12][13][14][17].
The weekly snapshot should be short and built for action. It should cover cash balance, weekly burn, runway, ARR or MRR movement, pipeline coverage, and collections status. Those are the numbers that drive near-term calls on hiring, spending, collections, and fundraising timing. If something needs attention, call it out plainly, like a large churn event or a delayed customer payment.
The monthly package should go deeper. It includes the finalized income statement, balance sheet, cash flow statement, and a closed-books budget vs. actual variance review, along with management commentary on what changed and why. Trust comes from steady definitions, steady timing, and reconciled actuals, not from the tool itself.
When the same metric definitions show up in the weekly snapshot, the monthly package, and the board deck, leadership stops arguing about the numbers and starts using them.
Use this cadence to feed rolling forecasts and variance analysis.
Rolling forecasts, scenario planning, and variance analysis help turn reporting into decisions. Once your reporting is up and running, you can use that same data to forecast what’s ahead, test different outcomes, and fix gaps before they get worse.
The 13-week cash model is your near-term control tool. It maps weekly cash in and cash out, including customer receipts, payroll runs, rent, vendor payments, tax obligations, and debt service. That gives you an early warning if cash gets tight. Each week, swap the finished week with actual results, drop the closed week, and add a new week at the end. Flag any week where cash falls below 2 to 4 weeks of operating expenses.[1][25][26][29]
The 12- to 18-month operating forecast sits at a higher level. It connects business drivers to revenue, gross margin, headcount cost, and runway.[19][24][30][33]
To keep the forecast useful, update the drivers that move cash the most:
Weekly cash and collections inputs shape near-term spending decisions. Monthly headcount and vendor inputs shape hiring plans and budget changes.[23][27][28]
Before making any material spending or pricing move, run three forecast versions from the same driver set.[18][20][21]
The base case reflects your current plan and expected conversion, churn, collections, and spending pace. The upside case assumes stronger bookings, better conversion, or faster product-market traction. The downside case assumes slower sales, delayed collections, or costs coming in above plan.
Then look at what each version does to runway, break-even timing, and growth. If the downside case shows runway dropping below a safe level in 5 to 6 months, you may need to delay spending, tighten collections, or start fundraising earlier. If the upside case shows the business can reach better revenue milestones with only modest added spend, the team may choose to raise later and on better terms.[18][21][22][32]
Scenarios only matter if they come with a response plan. If revenue lands 20% below plan for two straight months, decide in advance what gets cut first. If bookings come in 30% above plan, decide what gets accelerated. That kind of trigger-based planning - if X, then Y - is what makes scenario work practical instead of theoretical.[18][21][22][32]
Use the same driver set to compare plan, forecast, and actuals. The point isn’t to make another report. The point is to spot the biggest gap, figure out why it happened, and assign someone to fix it.
Run weekly checks for cash and near-term drivers, then monthly reforecasts for the P&L and cash. When a variance appears, break it down. Is it tied to revenue, like lower conversion, slower collections, or unexpected churn? Or is it tied to cost, like unplanned contractor spend, higher CAC, or delayed hiring that moved costs into a different period?
From there, assign:
Without that, variance analysis turns into a paper trail of problems instead of a way to solve them. Track cash, runway, conversion, churn, CAC, and burn together so the analysis stays linked to the KPI framework.[1][25][31]
Use this comparison to match the planning rhythm to the decision in front of you:
| Approach | Update Frequency | Data Requirements | Decision Speed | Best For |
|---|---|---|---|---|
| Static Annual Budget | Once per year | Low - historical actuals | Slow | Baseline targets, board alignment |
| Monthly Reforecasting | Monthly | Moderate - reconciled actuals + updated drivers | Moderate | Teams balancing discipline with flexibility |
| Real-Time Rolling Forecast | Weekly / continuous | High - integrated live data feeds | Fast | Runway management, rapid hiring and spend decisions |
Phoenix Strategy Group can help implement driver-based rolling forecasts, live-data integrations, and scenario models for major spend decisions.
Once your model and reporting rhythm are up and running, give every input and output a clear owner.
Real-time FP&A falls apart when ownership is fuzzy. Inputs get old. Metric definitions start to drift. Before long, two people are using the same label for two different numbers.
A simple split usually works best. The CEO signs off on major assumptions and owns the board story. The bookkeeper closes the books. The fractional CFO or finance lead owns the model and the board pack. Department heads own the operating drivers.
To make that stick, put it in writing with a clear FP&A responsibility matrix. Match each forecast input and KPI to an owner, approver, and contributor. For example, new ARR by segment might be owned by the Head of Sales, modeled by the fractional CFO, and approved by the CEO. Marketing CAC and payback might sit with the Head of Marketing, while finance keeps the calculation consistent. Department heads should supply the operating drivers: pipeline conversion, campaign budgets, launch timing, hiring plans, and unit economics.
Pair that with a KPI dictionary that spells out each metric’s formula, source, and cadence, so Gross Margin means the same thing everywhere.[39]
That setup keeps board reporting steady because every number has a name behind it and someone who signs off on it.
Use the same assumptions and variance notes from your rolling forecast in the board pack.
The board pack should come straight from the same system your team uses each week, not from a separate spreadsheet built by hand. If the board sees one set of numbers and the team runs the business on another, trust can slip fast.
For a U.S. growth-stage company, a strong board pack usually runs 15–25 pages and covers four core areas.[34]
Boards pay close attention to runway because it shapes funding timing and risk.[37] Send the pack 3–5 days in advance, keep the format steady, and tie every number back to the reconciled model.[36][38]
Put five pieces in place: unified source data, a KPI dictionary, a rolling forecast, weekly executive reporting, and board-ready ownership.
Phoenix Strategy Group can help with each step, from bookkeeping and accounting cleanup to FP&A model design, data pipelines, cash flow forecasting, and board-ready reporting for U.S. growth-stage companies.
For growth-stage companies, often in the $500,000 to $10,000,000 annual revenue range, spreadsheets tend to crack under pressure as the business gets more complex. The switch usually makes sense when version control problems, slow month-end closes, broken formulas, or mismatched KPI definitions start getting in the way of cash management, hiring, or board reporting.
It also makes sense to move past spreadsheets when manual data entry and reconciliation across CRM, billing, and ERP systems eat up too much time, lead to errors, or make it hard to see ARR, churn, burn rate, and scenario planning in real time.
For growth-stage companies, the KPIs that matter most often come down to the “Universal 5”:
That gives leaders a clean snapshot of the business. You can see how much cash is left, whether sales are moving, how much money each sale leaves behind, how heavy spending is relative to revenue, and what it costs to win a customer.
In day-to-day use, though, most teams do best with a tight scorecard of 5–7 KPIs tied directly to decisions. That short list often includes runway / net burn, revenue growth, pipeline coverage, CAC payback, and working-capital metrics like DSO.
The point isn’t to track everything. It’s to watch the numbers that help leaders decide what to cut, where to invest, and how fast the company can keep moving without running out of cash.
Update your cash forecast based on two things: how fast decisions need to happen and how much the business changes week to week. For most growth-stage companies, weekly updates are the standard rhythm for tracking liquidity, burn rate, and runway.
If cash moves fast, update the forecast daily. If the business is under acute financial stress, twice weekly can make sense. The aim is simple: use a schedule that helps your team act in time without moving faster than they can respond.