Published on
August 28, 2026

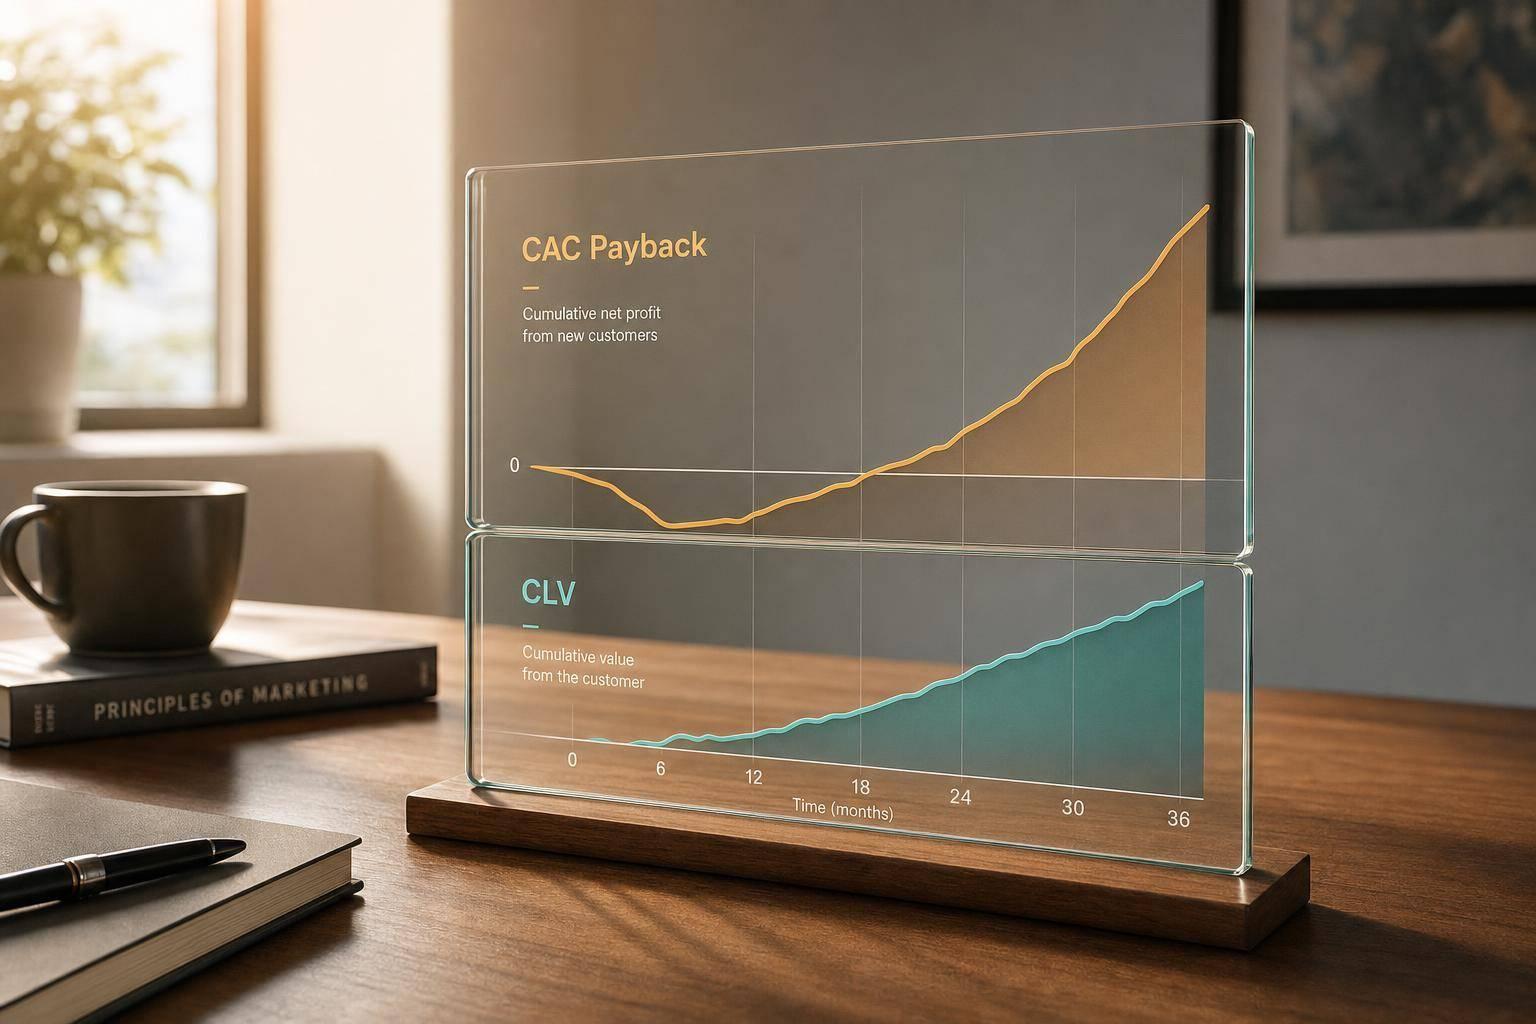
A business can show a strong CLV:CAC ratio and still run into a cash problem. If payback takes 24 months, a 5:1 ratio can be weaker than a 3:1 ratio with 8-month payback.
Here’s the short version: I look at CAC payback to see how fast cash comes back, and I look at CLV to see how much gross profit a customer will produce over time. Both need to work at once. If I track only one, I can miss weak unit economics, thin margins, high churn, or slow recovery of spend.
What matters most:
A few numbers stand out:
If I want growth that does not choke cash flow, I need one simple rule: recover CAC in a reasonable time and keep enough lifetime gross profit after that. That’s the lens for the full piece.
Use one model for CAC, payback, and CLV. The point isn’t just to track all three. It’s to make sure fast payback and strong CLV are telling the same story.
Customer Acquisition Cost (CAC) is your total sales and marketing spend divided by the number of new customers you brought in. It should be all-in: salaries, ad spend, tools, events, agency fees, and overhead. [1]
The CAC payback period tells you how many months it takes to earn that money back from monthly gross profit, not revenue. That distinction matters more than a lot of founders think. If you use top-line revenue here, the math looks better than the business actually is. [1]
CAC Payback (months) = CAC ÷ (Monthly ARPU × Gross Margin %)[1]
Customer Lifetime Value (CLV) measures the total gross profit a customer produces over the time they stay with you: [1]
CLV (simple model) = ARPU × Gross Margin % × (1 ÷ Monthly Churn Rate)[1]
This model assumes steady churn and no discounting.
Using revenue instead of gross margin throws off both metrics. [1] It’s an easy mistake, and it can send you in the wrong direction. At an 80% gross margin, $100,000 in revenue is only $80,000 in gross profit. [1] If your margin numbers are off, your CLV gets overstated and your spend can get too aggressive.
To calculate gross margin the right way, subtract full Cost of Goods Sold (COGS). That includes hosting, support, payment processing, and other delivery costs. [1]
Get this math right first. Then you can test whether payback speed and lifetime value are moving together, or if one is giving you a false sense of comfort.
Now that the formulas are clear, the next step is seeing how CAC payback and CLV fit together.
Payback is about liquidity - how fast you earn back what you spent. CLV is about long-term value - how much a customer is worth over time. You need both in good shape, and one can break while the other still looks fine.
A high CLV won't shield you from a cash crunch if payback drags on. CAC gets paid upfront, but the return comes in slowly over months or years. If your runway isn't long enough, strong unit economics on paper won't help much. On the flip side, fast payback doesn't mean much if customers churn soon after you recover CAC.
For growth-stage companies, a solid rule is to keep CLV:CAC at least 3:1 and make sure payback is fast enough to support reinvestment. There's also a point that trips people up: a very high CLV:CAC ratio - say, 8:1 - isn't always good news. It may mean you're not spending enough on growth and are giving up market share.
For example, a 5:1 ratio with a 24-month payback is worse for cash flow than a 3:1 ratio with an eight-month payback. That's the risk with slow payback. A business can look profitable in a spreadsheet and still run out of cash before the return shows up. [1]
A simple example makes the risk easy to see:
| Input | Segment A (Aligned) | Segment B (Misaligned) |
|---|---|---|
| Monthly ARPU | $2,000 | $2,000 |
| Gross Margin | 80% | 80% |
| Monthly Churn | 1.5% | 3.0% |
| CAC (Fully Loaded) | $12,000 | $12,000 |
| CAC Payback | 7.5 months | 7.5 months |
| CLV | $106,667 | $53,333 |
| CLV:CAC Ratio | 8.9:1 | 4.4:1 |
Doubling churn cuts CLV in half, even though payback stays the same. [1] If you only watched payback, both segments would seem equally efficient. But they're not. Segment B earns back CAC at the same pace, yet the customer relationship ends too early to produce enough gross profit.
That's why target ranges need to shift based on business model, channel, pricing, and gross margin.
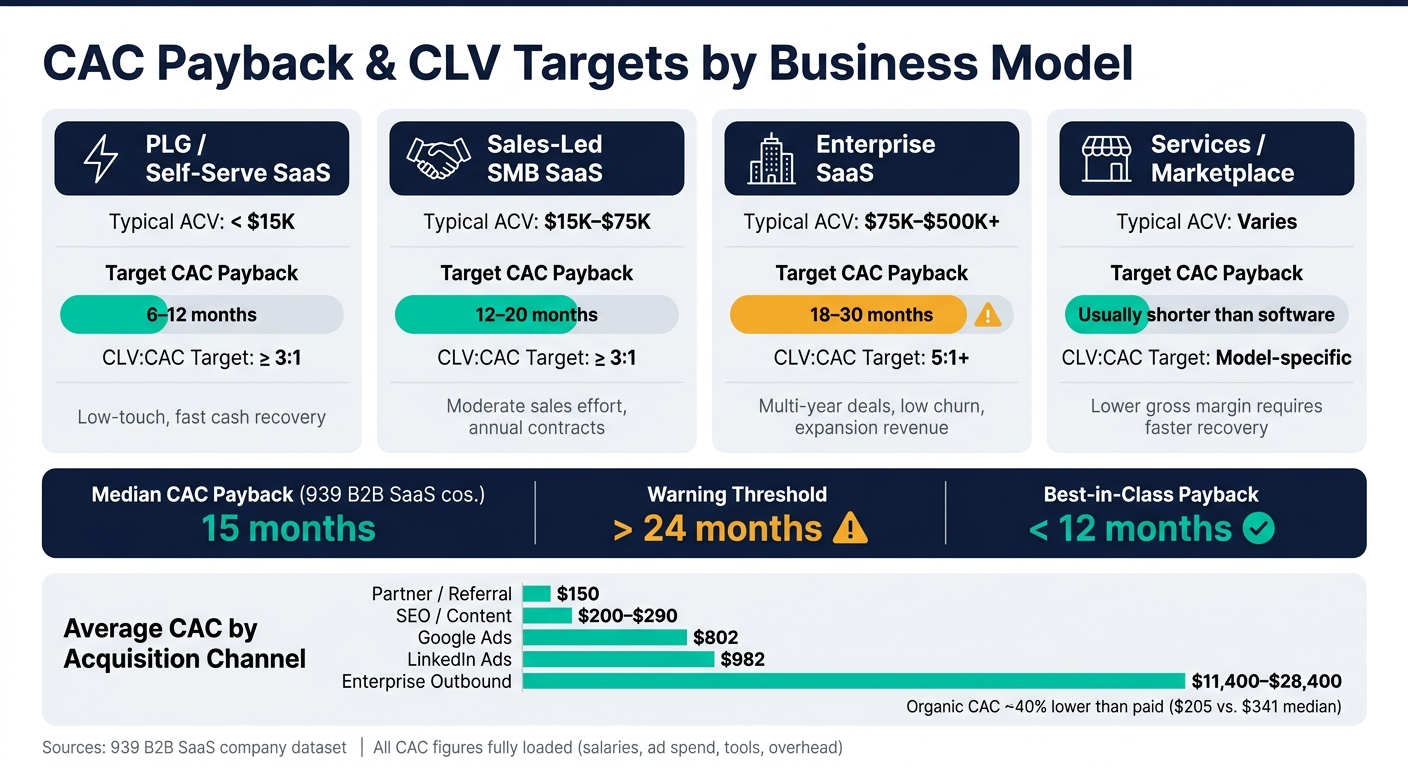
CAC Payback vs. CLV by Business Model: Benchmarks & Targets
Once CAC payback and CLV start lining up, the next step is to set a target range based on your model and channels. There isn't one "good" CAC payback period for every company. Your target should reflect gross margin, ACV, churn, sales cycle, and runway.
| Business Model | Typical ACV | Target CAC Payback | Gross-margin-adjusted CLV:CAC | What supports the range |
|---|---|---|---|---|
| PLG / self-serve SaaS | <$15K | 6–12 months | ≥3:1 | Low-touch, fast cash recovery |
| Sales-led SMB SaaS | $15K–$75K | 12–20 months | ≥3:1 | Moderate sales effort, annual contracts |
| Enterprise SaaS | $75K–$500K+ | 18–30 months | 5:1+ | Multi-year deals, low churn, and expansion revenue |
| Services / marketplace | Varies | Usually shorter than software because margins are thinner | Model-specific | Lower gross margin usually requires faster recovery |
Use these as benchmarks, then adjust for annual prepay and runway. Enterprise payback can stretch longer, but only when retention and expansion are already proven.
Across a dataset of 939 B2B SaaS companies, the median CAC payback was 15 months. Best-in-class came in under 12 months, and anything above 24 months was treated as a warning sign.[13] Annual billing cuts churn by 50–70% and can increase CLV by 2–4x, which makes a longer payback easier to defend. It also changes how fast cash comes back in, which is why payback and CLV need to be read together.[4][7] If your model depends on annual prepay, build that into the target.
Channel mix and pricing can then pull those ranges up or down.
Blended CAC can make things look cleaner than they are. In practice, channels vary a lot. Partner and referral channels average about $150 CAC. SEO/content usually lands around $200–$290. Google Ads averages $802, and LinkedIn Ads sits at $982. Enterprise outbound can go past $11,400–$28,400 per customer. That only works when ACV and retention are strong enough to support an 18–30 month payback.[11][12][14][15][20]
That’s why it helps to review payback and CLV by channel and acquisition cohort, not just at the company level.[17] Organic acquisition is usually 40% cheaper than paid, with median CAC at $205 vs. $341. The tradeoff is that it tends to scale more slowly, so the right mix depends on your growth timeline and cash position.[15][16][18][19]
Gross margin affects both payback and CLV more than many founders expect. Lower margin means slower CAC recovery and lower lifetime value.[5][6][8][10] A company running at 40% gross margin needs a tighter payback target, or a lower CAC, than one operating at 80%.
Pricing can help, but only if it doesn't bring churn along with it. Customers acquired through heavy discounting show 32% lower LTV than full-price customers, driven by higher churn and lower willingness to pay.[2][9] Here's what that looks like in dollar terms: at 80% gross margin and 1.5% monthly churn, a 20% discount on a $50,000 ACV deal cuts LTV from about $222,000 to $178,000. That's a $44,000 lifetime hit on a single customer.[3]
If delivery costs go up, you have a few levers to pull:
What you don't want to do is use discounting to push volume if it's eating away at lifetime economics.
Once you’ve set target ranges, keep a close eye on where actual cohorts start to drift.
A business can look profitable on paper and still run into cash timing problems. If sales and marketing spend keeps climbing without matching ARR growth, payback gets stretched, even when the CLV:CAC ratio still seems fine.
That’s the trap: a healthy-looking CLV:CAC ratio can still hide a long payback period.
There’s another issue here. Gross revenue can make CLV look better than it is, so use gross profit instead.
Median SaaS companies now spend $2.00 in sales and marketing for every $1.00 of new ARR, while bottom-quartile companies spend $2.82.[1] At those levels, weak spend can snowball fast.
When these signs show up, look at channel, cohort, and margin data together.
Review payback and CLV side by side by channel, segment, and cohort every month instead of quarterly.[1] Move budget toward channels that hit your payback target and still support CLV. Cut back or reduce spend on any channel that doesn’t.
On retention, even a small shift can change the math in a big way. A 0.5% improvement in monthly churn can produce a 33% increase in CLV.[1] That makes onboarding and early retention one of the fastest ways to improve CLV.
If gross margin is the issue, reprice or repackage before you add more volume at thin margins.
Use cohort-level reporting and FP&A to make these reviews part of the regular rhythm.
CAC payback tells you how long it takes to earn back what you spent to get a customer. CLV tells you whether that customer is worth that spend in the first place. Put them together in one decision framework: use payback to guard cash, and use CLV to guard value. Only fund growth when both stay inside your target range.
Calculate both using gross profit after COGS, not revenue.
A 5:1 LTV:CAC ratio with a 24-month payback is riskier for cash flow than a 3:1 ratio with an 8-month payback. [1]
Set targets based on your business model, then review payback and CLV by cohort, channel, and segment. If performance slips, start with retention and gross margin. Those two levers improve both payback and CLV.
When payback and CLV move in the same direction, growth is sustainable.
A high CLV:CAC ratio can hide cash flow risk. Why? Because it shows total long-term value, not when the cash lands in your account.
So even if your ratio looks strong at 3:1 or 5:1, you can still run into a liquidity crunch. That happens when CAC is paid upfront but revenue comes in slowly over time.
If payback stretches past 18 months, your cash stays tied up for too long. That can shrink your runway and leave you with less room for error.
Set CAC payback targets by business model, customer segment, and growth stage. Don’t rely on blended averages. They can blur what’s working and what’s not.
Calculate payback with this formula:
CAC / (Monthly ARPU × Gross Margin %)
If you want a tighter view, use CM2 instead.
Here’s a simple way to think about target ranges:
Healthy CAC payback can look good on paper. But if CLV is falling, that’s an early warning sign.
You might be getting your cash back fast while your long-term unit economics quietly slip.
Focus on a few areas:
The main point is simple: don’t use CAC payback as a stand-in for long-term health.