Published on
July 24, 2026

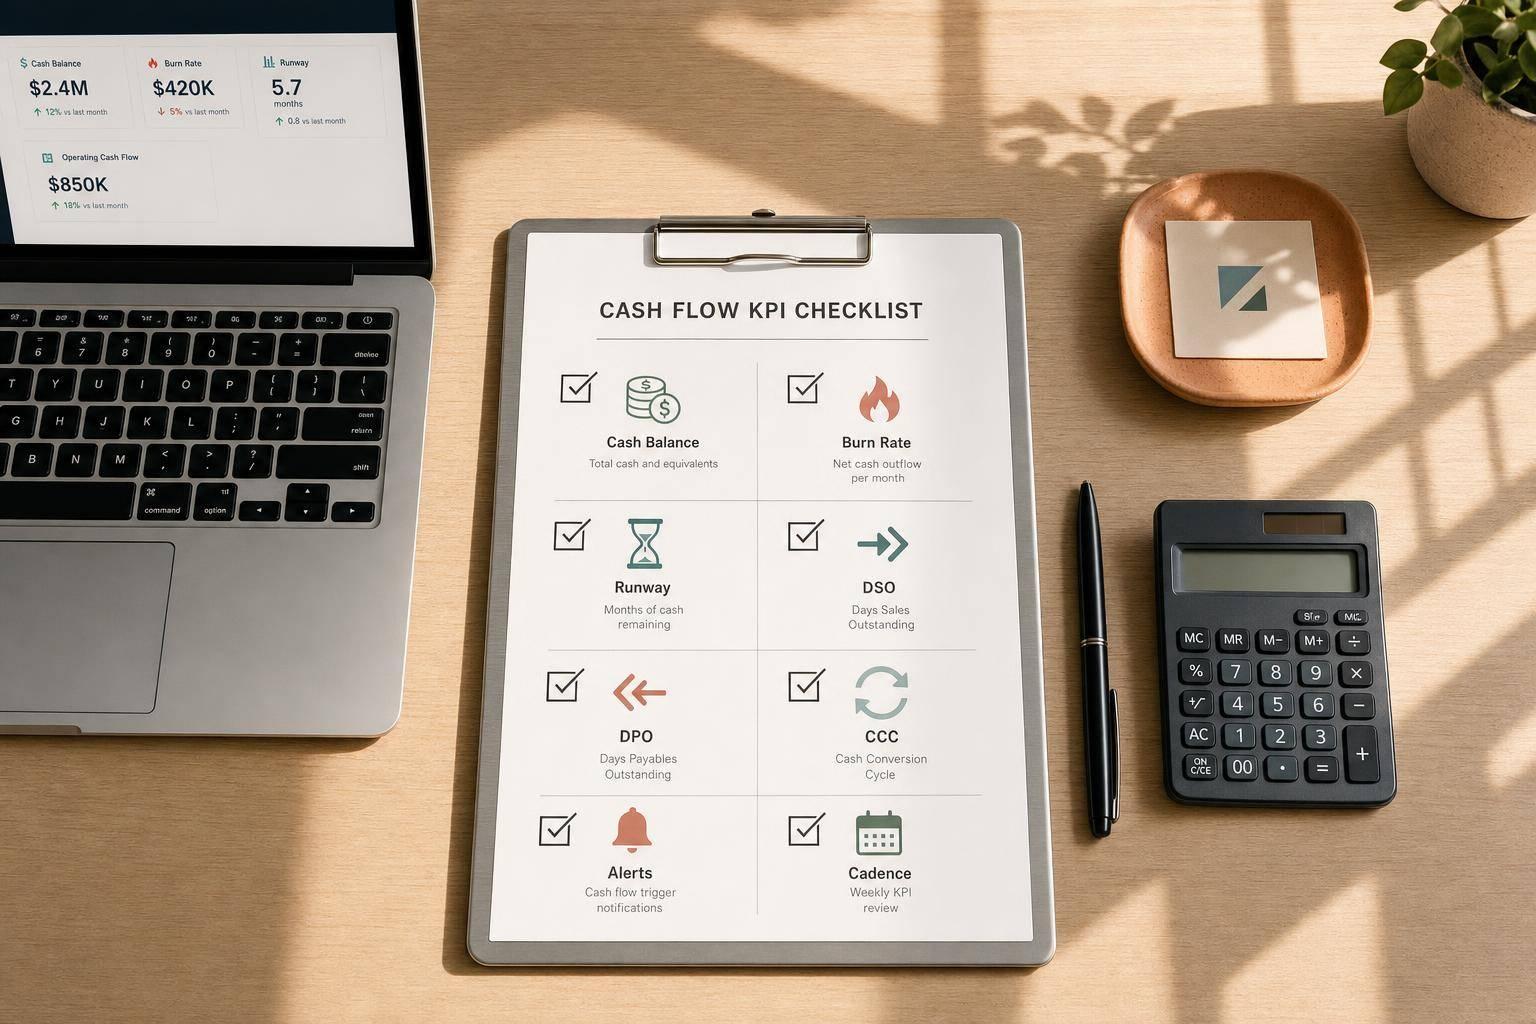
If I only tracked 8 cash KPIs each week and month, I’d track these: cash balance, minimum reserve, operating cash flow, quick ratio, net burn, runway, AR aging/DSO, and DPO/CCC.
Here’s the short version: for a firm doing $500,000 to $10 million a year, cash trouble usually starts with timing, not profit. Money comes in late. Payroll and vendor bills hit first. So I’d use a small KPI set tied to a weekly review, a monthly close, and a 13-week cash forecast.
What matters most:
A few numbers stand out:
What I like about this checklist is that it keeps the focus on payment capacity, forecast accuracy, and cash timing. It’s not about tracking more numbers. It’s about tracking the few that tell me whether cash is getting tight before it turns into a problem.
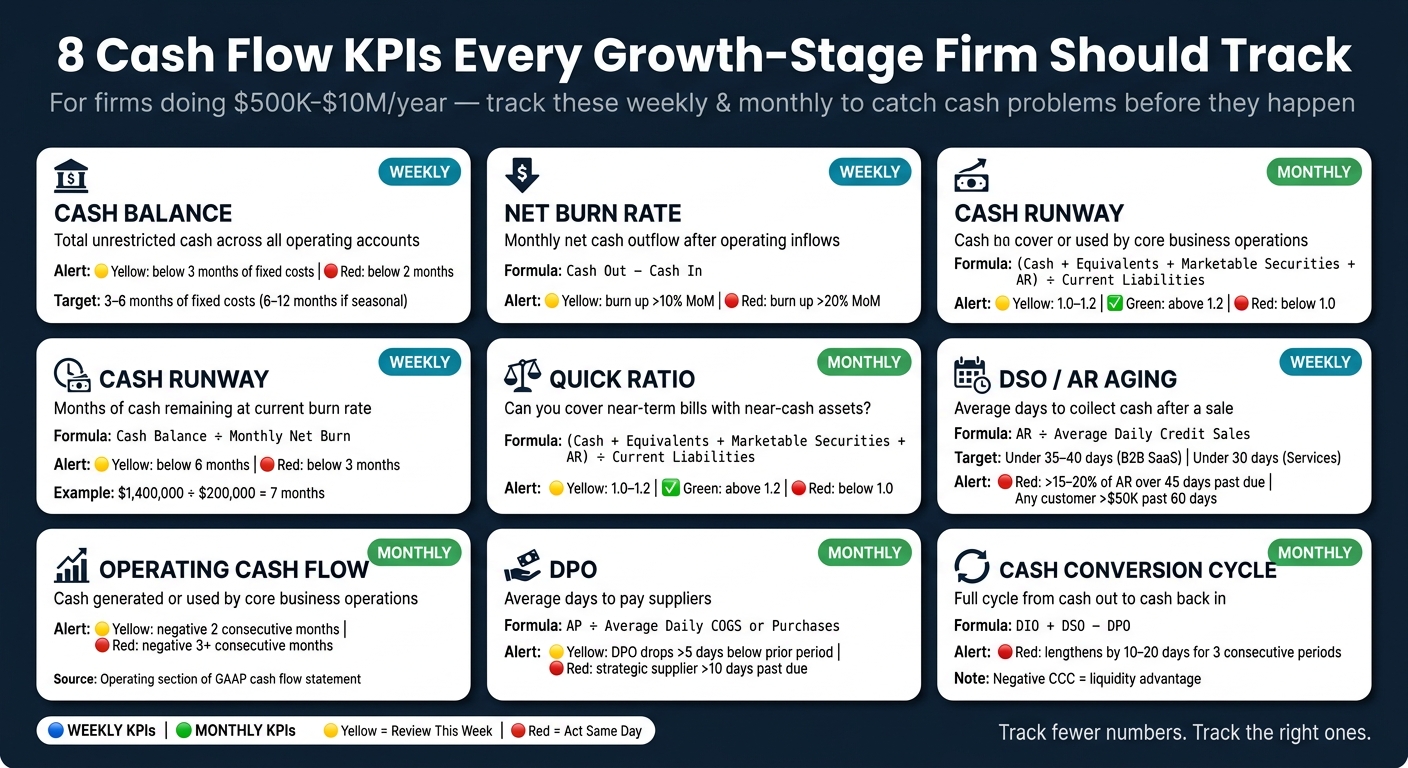
8 Cash Flow KPIs Every Growth-Stage Firm Should Track
Start here: these KPIs turn your 13-week cash forecast into a simple weekly liquidity check. The goal is straightforward: confirm you have enough cash and spot strain before it turns into a problem. Focus on cash balance, minimum reserve, operating cash flow, quick ratio, net burn, and runway.
Track beginning and ending cash every week, broken out by account type:
Use unrestricted cash to measure against your minimum reserve target. Set alerts at 3 months and 2 months of fixed costs.
A common target is 3–6 months of fixed operating costs such as payroll, rent, insurance, debt service, and must-have software. If your business is seasonal or depends on a small number of customers, push that target to 6–12 months.[2][4][6]
The controller usually prepares this daily. The CFO or fractional CFO reviews and validates it. Founders should review it weekly. A simple rule works well here: set a yellow alert when unrestricted cash drops below 3 months of fixed operating costs, and a red alert when it falls below 2 months.
If unrestricted cash starts slipping, look next at cash generation and near-term solvency.
Operating cash flow (OCF) shows how much cash your core business generates or uses. It maps to the operating section of the U.S. GAAP cash flow statement. If OCF stays negative for 3–6 straight months, that's a sign operations are draining cash.
Track OCF monthly, once the books are closed, usually by the 10th–15th of the next month. This metric is typically owned by your CFO or FP&A lead. Review it monthly after close, while founders keep an eye on the trend each week.
Quick ratio = (cash + cash equivalents + marketable securities + accounts receivable) ÷ current liabilities.
This metric helps answer a plain question: if bills came due soon, could you cover them with near-cash assets? A quick ratio below 1.0 is a common warning line for lenders and investors. Use yellow at 1.0–1.2 and green above 1.2.[3] Review it monthly after close, and have founders scan the trend weekly.
Net burn rate is your monthly cash outflow after operating inflows. Cash runway = unrestricted cash ÷ monthly net burn.
For example: $1,400,000 ÷ $200,000 net burn = 7 months of runway.[5][7]
Track both gross burn and net burn. That split matters. It shows whether changes come from stronger revenue, higher costs, or both. The usual owner here is the CFO or FP&A lead.
Review burn and runway weekly. Flag runway below 6 months. Treat anything under 3 months as urgent.[8]
If runway gets tighter, the next thing to check is timing: are receivables coming in too slowly, or are payables going out too fast?
Revenue growth can make things look fine on paper while cash gets tighter in the background. That usually happens when receivables slow down, inventory piles up, or payables speed up before collections do. Start by watching receivables, then payables, then the full cash conversion cycle.
Days Sales Outstanding (DSO) shows how many days it takes, on average, to collect cash after a sale: (Accounts Receivable ÷ Average Daily Credit Sales). For B2B SaaS, a good target is under 35–40 days. In services, aim for under 30 days. Age AR by due date, not invoice date, and flag trouble when more than 15–20% of AR is over 45 days or when any customer is more than $50,000 past 60 days.[9]
DSO tells you how fast cash comes in. It does not tell you where risk is piling up. That’s where AR aging helps. Aging buckets - current, 1–30, 31–60, 61–90, and 90+ days past due - show which invoices are slipping and how large the gap is.
Think of it this way: DSO gives you the headline number, while aging shows the trouble spots underneath it.
The AR manager or senior accountant owns the weekly aging review. The CFO or fractional CFO handles oversight and escalations. This should be treated as a cash-timing control, not just an accounting report, because every bucket shift changes your runway.
If collections slow down, the next place to look is payment timing.
Days Payable Outstanding (DPO) measures how long you take to pay suppliers: (Accounts Payable ÷ Average Daily Cost of Goods Sold or Purchases). Track DPO as a payment-timing measure, not as a habit of paying late. Flag invoices that are within 7 days of the due date and still unscheduled. Also flag strategic suppliers that are 10–15 days past due. Watch for DPO compression too - paying early cuts float and shortens runway.
The AP manager or controller owns the weekly AP review.
The cash conversion cycle (CCC) pulls receivables and payables into one view:
CCC = Days Inventory Outstanding (DIO) + DSO – DPO
A negative CCC means you collect cash before you pay it out, which gives you a liquidity edge. Review CCC every month. If it gets worse by 10–20 days for three straight periods, that points to a structural cash problem.
When CCC slips, break it apart and find the driver:
That way, you’re not just seeing that cash timing changed - you’re seeing exactly where it changed.
Once you know which KPIs matter, the next step is making them usable. A metric without an owner, cadence, and threshold isn’t something a team can act on. The point here is simple: turn each KPI into a working line item, not just a number on a screen.
Every KPI on your dashboard needs eight fields: metric name, plain-English definition, formula, reporting cadence, owner by role, alert thresholds, source system, and data quality status.[13][14] If even one is missing, the dashboard starts to drift into a reporting artifact instead of a decision tool.
Use the KPI definitions above to fill in each dashboard line item with these control fields:
| KPI | Definition | Formula | Cadence | Owner | Alert Threshold | Source System | Data Quality Status |
|---|---|---|---|---|---|---|---|
| Cash balance | Total unrestricted cash across operating accounts | Sum of ending bank balances less restricted cash | Weekly (Monday morning) | CFO | Yellow: below 3 months of fixed operating costs; Red: below 2 months | Bank feeds | Bank reconciliation complete; feed updated within 24 hours |
| Operating cash flow | Core cash from operations | Cash from operating activities per the cash flow statement | Monthly (after close) | Controller / FP&A lead | Yellow: negative for 2 consecutive months; Red: negative for 3 or more consecutive months | General ledger | Period closed; revenue and payroll posted to the correct period |
| Net burn rate | Monthly net cash outflow from operations | Cash out minus cash in for the period | Weekly | FP&A lead | Yellow: burn up more than 10% month over month; Red: burn up more than 20% month over month | General ledger / bank feeds | Subledgers tied; no unposted journals |
| Cash runway | Months of cash remaining at current burn | Cash balance ÷ monthly burn rate | Weekly | CFO | Yellow: below 6 months; Red: below 3 months | Bank feeds + burn model | Bank reconciliation complete; burn rate confirmed |
| AR aging | Receivables grouped by age bucket using due date | Current, 1–30, 31–60, 61+ days overdue | Weekly | AR lead | Red: more than 15%–20% of AR is over 45 days past due; Red: any single customer over $50,000 past 60 days | AR subledger | Subledger ties to GL; aging run by due date |
| DSO | Average days to collect receivables | AR ÷ average daily credit sales | Weekly if collections are tight; otherwise monthly | AR lead | Yellow: above 30 days; Red: above 45 days | AR subledger | Subledger reconciled; credit sales confirmed |
| DPO | Average days to pay suppliers | AP ÷ average daily COGS or purchases | Monthly | AP lead | Yellow: DPO drops more than 5 days below prior period; Red: strategic supplier more than 10 days past due | AP subledger | AP subledger ties to GL |
| Cash conversion cycle | DIO + DSO − DPO | DIO + DSO − DPO | Monthly | Controller / FP&A lead | Red: lengthens by 10–20 days for three consecutive periods | GL + AR + AP subledgers | All three components reconciled for the period |
Once those fields are in place, define what actually triggers action.
Thresholds work best when they’re set in both percentage and dollar terms. A 10% forecast variance might sound manageable, but it can still hide a big cash swing. That’s why founders should look at both the percentage and the dollar impact at the same time. A simple three-band setup works well: green means on plan, yellow means review this week, and red means an immediate cash risk that needs same-day action.
When a metric hits yellow, the finance owner and CFO should be notified that same day. If it turns red, it should go straight to the founder or CEO and come with a corrective plan within 24 hours, not at the next scheduled review.[12] The escalation rule should also spell out how the alert gets delivered, whether that’s Slack, email, or a live finance meeting. The owner should add a short comment explaining the variance. The goal is to make alerts lead straight to action.
Alerts only help if the data behind them is current and reconciled.
A dashboard built on stale or unreconciled data can give a false sense of control. Before any founder review, finance should confirm four things: bank reconciliations are complete, AR and AP subledgers tie to the general ledger, revenue and payroll are posted to the correct accounting period, and dashboard feeds have refreshed within the expected lag window.[10][11]
If any of those checks fail, the KPI should show a clear data-quality flag instead of a number that looks final but isn’t. Use the data quality status column in the table above to mark each metric before the dashboard goes live for founder review.[13][14] That gives the founder a plain signal about which numbers are ready for action and which ones need to wait.
Once the dashboard is set up, the next step is cadence. That’s what turns a set of numbers into a control system.
Run this review every week for 30–45 minutes. The core group should include the founder, the finance lead, and any team leads tied to collections or spending. The point of the meeting is simple: make decisions, not just read out numbers.
Go through the agenda in the same order as the dashboard:
Use the weekly meeting to catch issues early. Then use month-end to sort out what changed and reset the forecast.
After month-end close, finance should prepare a direct or indirect cash flow statement, reconcile it to bank activity, and then run an actual-vs.-forecast comparison for the closed month. [1][16][17]
From there, classify each variance as either timing or structural across collections, payables, or burn. Then update the 13-week forecast and reset any threshold that no longer matches current conditions. Each KPI owner should leave with a clear commitment for the next period, and the team should document decisions and owners in a short summary. [1][16][17]
Weekly review drives action. Month-end review improves forecast accuracy.
Every growth-stage firm needs a founder-level cash dashboard that covers cash balance, operating cash flow, net burn, runway, AR aging, DSO, DPO, and cash conversion cycle. Each KPI should have a clear definition, reporting cadence, named owner, alert threshold, and data quality status.
That setup, paired with a steady weekly and monthly review rhythm, turns a static checklist into a live management tool. Firms that do this well don’t just avoid cash surprises. They make faster, more confident calls on hiring, pricing, and fundraising because they know where they stand at all times.
Start with a burn rate analysis and compare it against industry benchmarks. The goal is simple: keep at least six months of runway. If you're running a growth-stage company, it also helps to hold a 15% cash buffer to protect against swings that can show up during fast scaling.
Then tighten the target by modeling three cases:
It also helps to set a board-approved floor. If forecasted runway drops below that line, cost-control actions should kick in right away.
If your cash runway is shrinking fast, switch to emergency mode and protect liquidity.
Start by reviewing your burn rate so you know exactly where things stand. Then cut costs where you can, such as freezing hires and trimming discretionary spending.
At the same time, get ready for bridge financing or a strategic pivot to buy more runway. Fundraising often takes three to six months, so don’t wait too long. Once runway hits the six-month mark, it’s time to act.
Improve cash flow by getting more out of the capital you already have, not just by slashing spend. The goal is simple: bring cash in sooner, push cash out later, and stop letting money sit idle.
A few moves can make a big difference:
Think of it like tightening the timing on both sides of the business. If customers pay faster and suppliers give you more time, you create more breathing room without changing your top-line sales.